Last active
May 24, 2023 02:26
-
-
Save MattCowgill/f0b29f8925a784b8148306a8911d7a5e to your computer and use it in GitHub Desktop.
This file contains bidirectional Unicode text that may be interpreted or compiled differently than what appears below. To review, open the file in an editor that reveals hidden Unicode characters.
Learn more about bidirectional Unicode characters
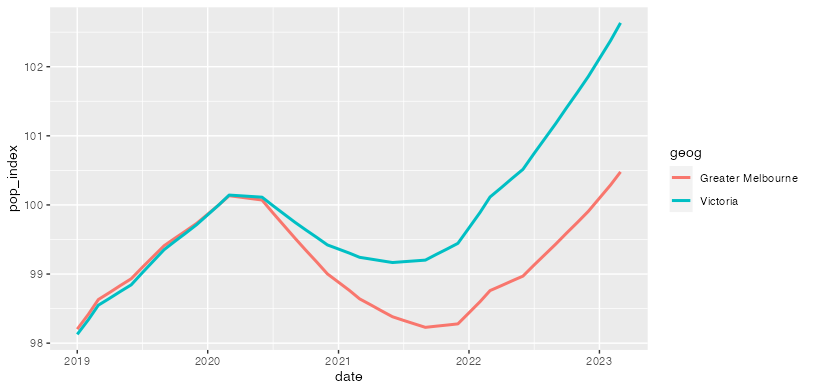
| library(tidyverse) | |
| library(readabs) | |
| pop_raw <- read_abs_series(c("A84595514A", | |
| "A84595604F")) |> | |
| select(date, series, value) | |
| pop_raw |> | |
| separate_series(c("geog", "indicator", "sex")) |> | |
| filter(date >= ymd("2019-01-01")) |> | |
| group_by(geog) |> | |
| mutate(pop_index = (value / value[date == ymd("2020-02-01")]) * 100) |> | |
| ggplot(aes(x = date, y = pop_index, col = geog)) + | |
| geom_line() |
Author
MattCowgill
commented
May 23, 2023
Sign up for free
to join this conversation on GitHub.
Already have an account?
Sign in to comment