Created
December 17, 2018 00:31
-
-
Save MikeTheWatchGuy/397b681d1b3863a74936724fdfd1ea34 to your computer and use it in GitHub Desktop.
This file contains bidirectional Unicode text that may be interpreted or compiled differently than what appears below. To review, open the file in an editor that reveals hidden Unicode characters.
Learn more about bidirectional Unicode characters
| import sys | |
| if sys.version_info[0] >= 3: | |
| import PySimpleGUI as sg | |
| else: | |
| import PySimpleGUI27 as sg | |
| import math | |
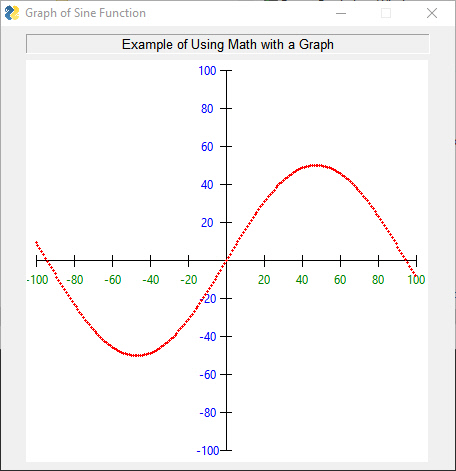
| layout = [[sg.T('Example of Using Math with a Graph', justification='center', | |
| size=(50,1), relief=sg.RELIEF_SUNKEN)], | |
| [sg.Graph(canvas_size=(400, 400), | |
| graph_bottom_left=(-105,-105), | |
| graph_top_right=(105,105), | |
| background_color='white', | |
| key='graph')],] | |
| window = sg.Window('Graph of Sine Function', grab_anywhere=True).Layout(layout).Finalize() | |
| graph = window.FindElement('graph') | |
| # Draw axis | |
| graph.DrawLine((-100,0), (100,0)) | |
| graph.DrawLine((0,-100), (0,100)) | |
| for x in range(-100, 101, 20): | |
| graph.DrawLine((x,-3), (x,3)) | |
| if x != 0: | |
| graph.DrawText( x, (x,-10), color='green') | |
| for y in range(-100, 101, 20): | |
| graph.DrawLine((-3,y), (3,y)) | |
| if y != 0: | |
| graph.DrawText( y, (-10,y), color='blue') | |
| # Draw Graph | |
| for x in range(-100,100): | |
| y = math.sin(x/30)*50 | |
| graph.DrawCircle((x,y), 1, line_color='red', fill_color='red') | |
| event, values = window.Read() |
Author
MikeTheWatchGuy
commented
Dec 17, 2018
Sign up for free
to join this conversation on GitHub.
Already have an account?
Sign in to comment