BanyanDB is a distributed database management system that offers a highly scalable and fault-tolerant solution for storing and processing large-scale data. To evaluate and improve the performance of BanyanDB's query subsystem, it is necessary to implement several features, such as self-observability and query plan visualization. I will implement the following tasks over the google summer of Code period: Implement EXPLAIN for both measure query and stream query to evaluate the query subsystem performance with real traffic and load. Add self-observability by implementing tracing and metrics to understand better how the internal physical plans work and identify any bottlenecks impacting query performance. Add support for EXPLAIN in the client SDK & CLI to make it easier for developers to use this feature and to enable them to optimize their queries. Add query plan visualization to the UI to make it easier for users to understand the execution plan of their queries and to identify any areas for optimization.
The first task is to support EXPLAIN for both measure query and stream query, enabling the visualization of physical plans for the queries. To achieve this, we must identify the data distribution and optimization rules used in the query subsystem and organize the physical plans accordingly.
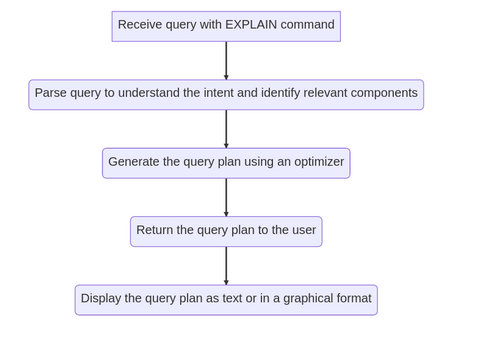
EXPLAIN command/endpoint: We will add a new endpoint/command to the BanyanDB API, accepting a query with explain command and returning the query plan as a JSON object or text format. Implement/Modify the query parser: Once a query is received, it needs to be parsed to identify the operation requested and to extract relevant information, such as the table name, columns to be selected, filters, and join conditions. This information is required for optimizing the query. Generate the Execution Plan: In BanyanDB, the execution plan is generated through a hierarchical representation based on the query optimizer's physical plan. This optimizer utilizes a cost-based optimization method, which considers data and system statistics, to create the most efficient physical plan for a given query. To build an optimal query plan, we will utilize the same optimizer employed during query execution. This plan will be constructed with regard to the data distribution and predefined optimization rules. Return the PLAN: Return the Plan in a human-readable format such as JSON or text. Here's an example of how the new EXPLAIN command might work in Go:
// Define the API endpoint for EXPLAIN
func handleExplain(w http.ResponseWriter, r *http. Request) {
  // Parse the query from the request body
  query:= parseQuery(r. Body)

  // Optimize the query and generate the plan
  plan := optimizeQuery(query)

  // Return the plan as a JSON object
  json.NewEncoder(w).Encode(plan)
}
The query subsystem in SkyWalking-BanyanDB lacks self-observability, making it difficult to understand how the internal physical plans work and identify bottlenecks that may impact query performance. So we need to Add self-observability by implementing tracing and metrics in the query subsystem.
Tracing will allow us to identify the path of a query through the system and measure the time spent at each step. At the same time, metrics will provide more granular information about resource utilization and performance. A list of functionalities I will be implementing a list of functionalities for this task: Implement tracing in the query subsystem to capture the flow of requests and responses. Define the necessary metrics to monitor query performance, such as the number of queries, query latency, and error rates. Implement the necessary instrumentation in the codebase to capture the defined metrics. Configure the tracing and metrics systems to send data to the appropriate backends, such as OpenTelemetry and Prometheus. Develop dashboards to visualize the captured metrics and trace data to make it easy to identify bottlenecks and understand how the internal physical plans work. To add tracing to the query subsystem, we will instrument each operator in the physical plan with an OpenTelemetry span. A span represents a unit of work in a distributed system and can be used to measure the time spent in each operator. The spans will be linked to form a trace, representing the entire path of a query through the system.
Modify the client SDK and CLI to support the EXPLAIN statement. Implement a query plan visualization component in the UI. Integrate the query plan visualization component with the query execution engine to display the execution plan graphically. Enhance the UI to display tracing data and metrics received from the API endpoint. Project Timeline