Created
May 22, 2022 04:25
-
-
Save OTStats/1b1b0a78e06089163f30a241f990a423 to your computer and use it in GitHub Desktop.
This file contains bidirectional Unicode text that may be interpreted or compiled differently than what appears below. To review, open the file in an editor that reveals hidden Unicode characters.
Learn more about bidirectional Unicode characters
| # -- Load libraries | |
| library(tidyverse) | |
| library(glue) | |
| library(readxl) | |
| library(magick) | |
| # -- Read and prep data | |
| # Manually pulled data from Vini's La Liga stats from Transfermarkt | |
| # https://www.transfermarkt.us/vinicius-junior/leistungsdatendetails/spieler/371998/plus/1?saison=&verein=418&liga=&wettbewerb=&pos=&trainer_id= | |
| df <- readxl::read_excel(path = "Desktop/vini.xlsx") %>% | |
| janitor::clean_names() %>% | |
| filter(pos %in% c("CF", "LW", "RW", "SS")) %>% | |
| mutate(sub_on = str_remove(sub_on, "'") %>% as.numeric(), | |
| sub_off = str_remove(sub_off, "'") %>% as.numeric(), | |
| min_played = str_remove(min_played, "'") %>% as.numeric(), | |
| start = if_else(!is.na(sub_on), sub_on, 0), | |
| end = if_else(!is.na(sub_off), sub_off, 90), | |
| start = if_else(start == end, start - 1, start), | |
| test = if_else(start == end, 1, 0), | |
| season_text = str_c(season - 1, "/", season-2000)) | |
| base_plot <- df %>% | |
| group_by(season) %>% | |
| mutate(games_played = n(), | |
| tot_min_played = sum(min_played) %>% scales::comma()) %>% | |
| ungroup() %>% | |
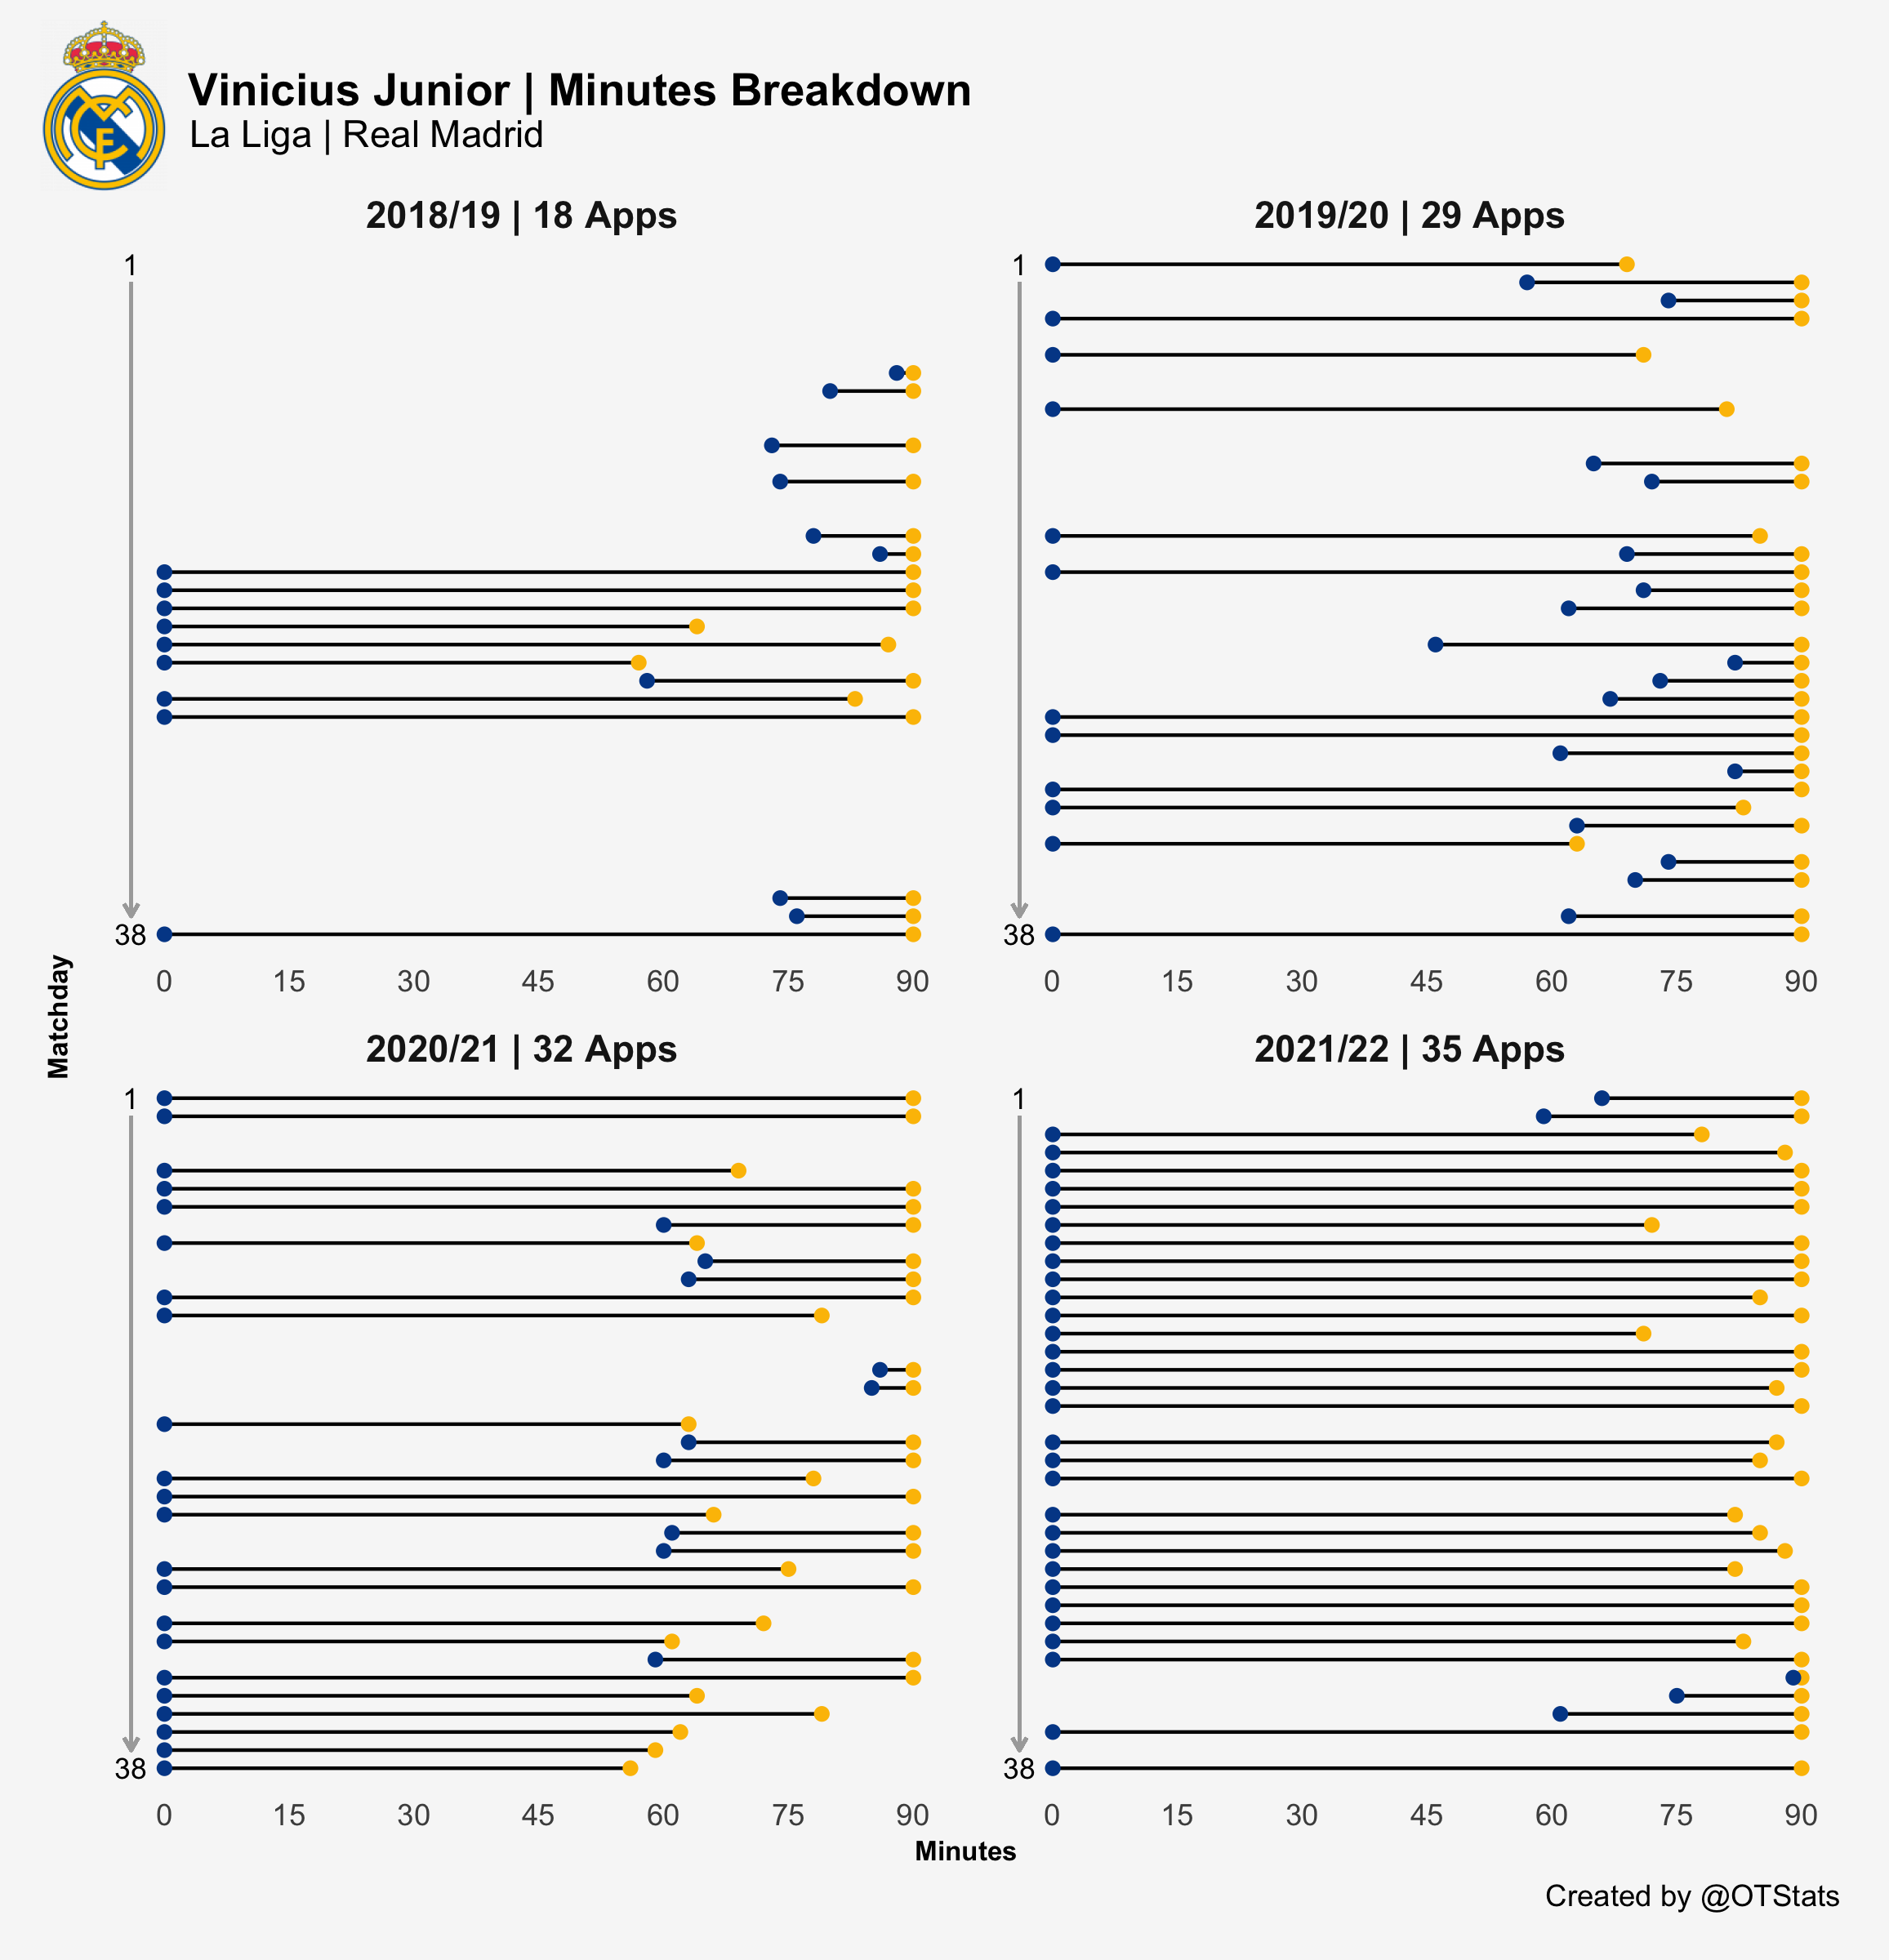
| mutate(season_facet = glue("{season_text} | {games_played} Apps")) %>% | |
| ggplot() + | |
| geom_segment(aes(x = start, xend = end, y = matchday, yend = matchday)) + | |
| geom_curve(aes(x = -4, xend = -4, | |
| y = 2, yend = 37), | |
| color = "darkgrey", | |
| curvature = 0, | |
| arrow = arrow(length = unit(0.02, "npc"))) + | |
| annotate( | |
| "text", | |
| x = -4, | |
| y = 1, | |
| label = "1", | |
| size = 3 | |
| ) + | |
| annotate( | |
| "text", | |
| x = -4, | |
| y = 38, | |
| label = "38", | |
| size = 3 | |
| ) + | |
| geom_point(aes(x = end, y = matchday), color = "#fcbf00") + | |
| geom_point(aes(x = start, y = matchday), color = "#004996") + | |
| scale_y_reverse(labels = NULL, expand = c(0, 1)) + | |
| scale_x_continuous(breaks = c(0, 15, 30, 45, 60, 75, 90)) + | |
| facet_wrap(~season_facet, scales = "free") + | |
| labs(y = "Matchday", | |
| x = "Minutes", | |
| title = "Vinicius Junior | Minutes Breakdown", | |
| subtitle = "La Liga | Real Madrid", | |
| caption = "Created by @OTStats") + | |
| theme_minimal() + | |
| theme(plot.margin = margin(0.75, 0.5, 0.5, 0.5, "cm"), | |
| plot.title = element_text(size = 14, | |
| face = "bold", | |
| hjust = .1, | |
| margin = margin(0.25, .1, 1.5, .1)), | |
| plot.subtitle = element_text(hjust = .07, margin = margin(0, .1, 8, .1)), | |
| axis.title = element_text(face = "bold", size = 8), | |
| panel.border = element_blank(), | |
| panel.grid = element_blank(), | |
| strip.text = element_text(face = "bold", hjust = .5, size = 11)) | |
| ggsave(filename = "base-plot.png", | |
| plot = base_plot, | |
| bg = "grey97", | |
| width = 7.71, height = 8, units = "in") | |
| # Use Thomas Mock's function to add a logo to plot. Suuuuper helpful tutorial | |
| # https://themockup.blog/posts/2019-01-09-add-a-logo-to-your-plot/ | |
| add_logo <- function(plot_path, logo_path, logo_position, logo_scale = 10){ | |
| # Requires magick R Package https://github.com/ropensci/magick | |
| # Useful error message for logo position | |
| if (!logo_position %in% c("top right", "top left", "bottom right", "bottom left")) { | |
| stop("Error Message: Uh oh! Logo Position not recognized\n Try: logo_positon = 'top left', 'top right', 'bottom left', or 'bottom right'") | |
| } | |
| # read in raw images | |
| plot <- magick::image_read(plot_path) | |
| logo_raw <- magick::image_read(logo_path) | |
| # get dimensions of plot for scaling | |
| plot_height <- magick::image_info(plot)$height | |
| plot_width <- magick::image_info(plot)$width | |
| # default scale to 1/10th width of plot | |
| # Can change with logo_scale | |
| logo <- magick::image_scale(logo_raw, as.character(plot_width/logo_scale)) | |
| # Get width of logo | |
| logo_width <- magick::image_info(logo)$width | |
| logo_height <- magick::image_info(logo)$height | |
| # Set position of logo | |
| # Position starts at 0,0 at top left | |
| # Using 0.01 for 1% - aesthetic padding | |
| if (logo_position == "top right") { | |
| x_pos = plot_width - logo_width - 0.01 * plot_width | |
| y_pos = 0.01 * plot_height | |
| } else if (logo_position == "top left") { | |
| x_pos = 0.01 * plot_width | |
| y_pos = 0.01 * plot_height | |
| } else if (logo_position == "bottom right") { | |
| x_pos = plot_width - logo_width - 0.01 * plot_width | |
| y_pos = plot_height - logo_height - 0.01 * plot_height | |
| } else if (logo_position == "bottom left") { | |
| x_pos = 0.01 * plot_width | |
| y_pos = plot_height - logo_height - 0.01 * plot_height | |
| } | |
| # Compose the actual overlay | |
| magick::image_composite(plot, logo, offset = paste0("+", x_pos, "+", y_pos)) | |
| } | |
| # -- Add Madrid logo to plot | |
| plot_with_logo <- add_logo(plot_path = "base-plot.png", logo_path = "Downloads/rm.png", logo_position = "top left", logo_scale = 11) | |
| # -- Save plot | |
| magick::image_write(plot_with_logo, "20220521-Vinicius-Junior-minutes-breakdown.png") |
Author
OTStats
commented
May 22, 2022
Sign up for free
to join this conversation on GitHub.
Already have an account?
Sign in to comment