Created
January 19, 2022 13:41
-
-
Save OTStats/4607cd8771a6ebc9c6b4c8a09295ac2e to your computer and use it in GitHub Desktop.
This file contains bidirectional Unicode text that may be interpreted or compiled differently than what appears below. To review, open the file in an editor that reveals hidden Unicode characters.
Learn more about bidirectional Unicode characters
| # Levante UD Rolling xG Plot | |
| # Owen Thompson | |
| # 2022-01-18 | |
| # -- Load libraries | |
| library(tidyverse) | |
| library(ggtext) | |
| # -- Resources ----------------------------------. | |
| # Adjust Transparency (alpha) of stat_smooth lines, not just transparency of Confidence Interval | |
| # https://stackoverflow.com/questions/19474552/adjust-transparency-alpha-of-stat-smooth-lines-not-just-transparency-of-confi | |
| # Levante colors: | |
| # https://encycolorpedia.com/teams/football/la-liga/levante-ud | |
| # Borg Typeface: Levante Font | |
| # https://psdhub.com/downloads/borg-typeface-free/ | |
| # # library(showtext) | |
| # # showtext_auto() | |
| # # font_add(family = "borg", regular = "~/Downloads/Borg.ttf") | |
| # -- Import Data | |
| spi_raw <- read_csv("https://projects.fivethirtyeight.com/soccer-api/club/spi_matches.csv") | |
| # Prep data | |
| matches <- spi_raw %>% | |
| transmute(date, | |
| league, | |
| league_id, | |
| team = team1, | |
| opponent = team2, | |
| teamGoal = score1, | |
| oppGoal = score2, | |
| result = case_when(score1 > score2 ~ "W", | |
| score1 < score2 ~ "L", | |
| score1 == score2 ~ "D"), | |
| ha = "Home", | |
| team_spi = spi1, | |
| opponent_spi = spi2, | |
| team_xg = xg1, | |
| opponent_xg = xg2) %>% | |
| bind_rows( | |
| spi_raw %>% | |
| transmute(date, | |
| league, | |
| league_id, | |
| team = team2, | |
| opponent = team1, | |
| teamGoal = score2, | |
| oppGoal = score1, | |
| result = case_when(score1 < score2 ~ "W", | |
| score1 > score2 ~ "L", | |
| score1 == score2 ~ "D"), | |
| ha = "Away", | |
| team_spi = spi2, | |
| opponent_spi = spi1, | |
| team_xg = xg2, | |
| opponent_xg = xg1)) %>% | |
| mutate(game_goal_diff = teamGoal - oppGoal) %>% | |
| mutate(result_points = case_when(result == "W" ~ 3, | |
| result == "D" ~ 1, | |
| TRUE ~ 0)) | |
| # -- Create Levante table | |
| levante <- matches %>% | |
| filter(league_id == 1869) %>% | |
| filter(str_detect(team, "Levante")) %>% | |
| arrange(date) %>% | |
| filter(between(date, lubridate::ymd("2018-07-30"), lubridate::ymd("2022-01-15"))) %>% | |
| mutate(id = row_number(), | |
| xg_diff = team_xg - opponent_xg, | |
| rolling_xGF = slider::slide_dbl(team_xg, mean, .before = 10, .after = 0), | |
| rolling_xGC = slider::slide_dbl(opponent_xg, mean, .before = 10, .after = 0), | |
| rolling_xGdiff = slider::slide_dbl(xg_diff, mean, .before = 10, .after = 0)) | |
| second_last_win <- levante %>% | |
| filter(result == "W") %>% | |
| arrange(desc(date)) %>% | |
| pull(id) %>% | |
| .[2] | |
| most_recent_win <- levante %>% | |
| filter(result == "W") %>% | |
| arrange(desc(date)) %>% | |
| pull(id) %>% | |
| .[1] | |
| # # Paco Lopez sacked | |
| # lopez_sack <- levante %>% | |
| # filter(date > lubridate::ymd("2021-10-03")) %>% | |
| # head(1) %>% | |
| # pull(id) | |
| # -- Plot Rolling xG | |
| levante %>% | |
| ggplot(aes(x = id)) + | |
| # Highlight losing stretch | |
| annotate(geom = "rect", | |
| xmin = second_last_win, | |
| xmax = most_recent_win - 1, | |
| ymin = 0, ymax = 2.75, | |
| fill = "#fca400", | |
| alpha = 0.2,) + | |
| annotate("text", | |
| x = 110, | |
| y = 2.5, | |
| label = "27-Game Winless Run", | |
| color = "#dca43e", | |
| size = 5, | |
| hjust = 0, | |
| vjust = 1) + | |
| # Partial Average Annotation | |
| annotate("text", | |
| x = 1, | |
| y = 0.9, | |
| label = "• Partial Average", | |
| size = 4, | |
| hjust = 0, | |
| vjust = 1, | |
| alpha = 0.7) + | |
| geom_line(aes(y = rolling_xGC), color = "#b4053f") + | |
| geom_point(aes(y = rolling_xGC), color = "#b4053f", size = 1.5) + | |
| geom_point(data = levante %>% filter(id < 10), | |
| aes(x = id, y = rolling_xGC), size = .9) + | |
| geom_point(data = levante %>% filter(id >= 10), | |
| aes(x = id, y = rolling_xGC), size = .9, color = "white") + | |
| geom_line(aes(y = rolling_xGF), color = "#005ca5") + | |
| geom_point(aes(y = rolling_xGF), color = "#005ca5", size = 1.5) + | |
| geom_point(data = levante %>% filter(id < 10), | |
| aes(x = id, y = rolling_xGF), size = .9) + | |
| geom_point(data = levante %>% filter(id >= 10), | |
| aes(x = id, y = rolling_xGF), size = .9, color = "white") + | |
| scale_x_continuous(breaks = c(38, 77, 115), | |
| minor_breaks = NULL, | |
| limits = c(0, most_recent_win + 2), | |
| expand = c(0, 0)) + | |
| scale_y_continuous(limits = c(0, 2.9), | |
| expand = c(0, 0)) + | |
| # Trend lines | |
| geom_line(aes(y = rolling_xGF), | |
| stat = "smooth", | |
| method = "lm", | |
| formula = y ~ x, | |
| color = "#005ca5", | |
| linetype ="dashed", | |
| alpha = 0.5) + | |
| geom_line(aes(y = rolling_xGC), | |
| stat = "smooth", | |
| method = "lm", | |
| formula = y ~ x, | |
| color = "#b4053f", | |
| linetype ="dashed", | |
| alpha = 0.5) + | |
| # 2018-19 annotation | |
| annotate(geom = "segment", | |
| x = 1, xend = 38, | |
| y = 2.75, yend = 2.75) + | |
| annotate(geom = "text", | |
| x = 19, y = 2.81, | |
| label = "2018-19", | |
| size = 4) + | |
| # 2019-20 annotation | |
| annotate(geom = "segment", | |
| x = 39, xend = 77, | |
| y = 2.75, yend = 2.75) + | |
| annotate(geom = "text", | |
| x = 57, y = 2.81, | |
| label = "2019-20", | |
| size = 4) + | |
| # 2020-21 annotation | |
| annotate(geom = "segment", | |
| x = 78, xend = 115, | |
| y = 2.75, yend = 2.75) + | |
| annotate(geom = "text", | |
| x = 95, y = 2.81, | |
| label = "2020-21", | |
| size = 4) + | |
| # 2021-22 annotation | |
| annotate(geom = "segment", | |
| x = 116, xend = 134, | |
| y = 2.75, yend = 2.75) + | |
| annotate(geom = "text", | |
| x = 125, y = 2.81, | |
| label = "2021-22", | |
| size = 4) + | |
| theme_minimal() + | |
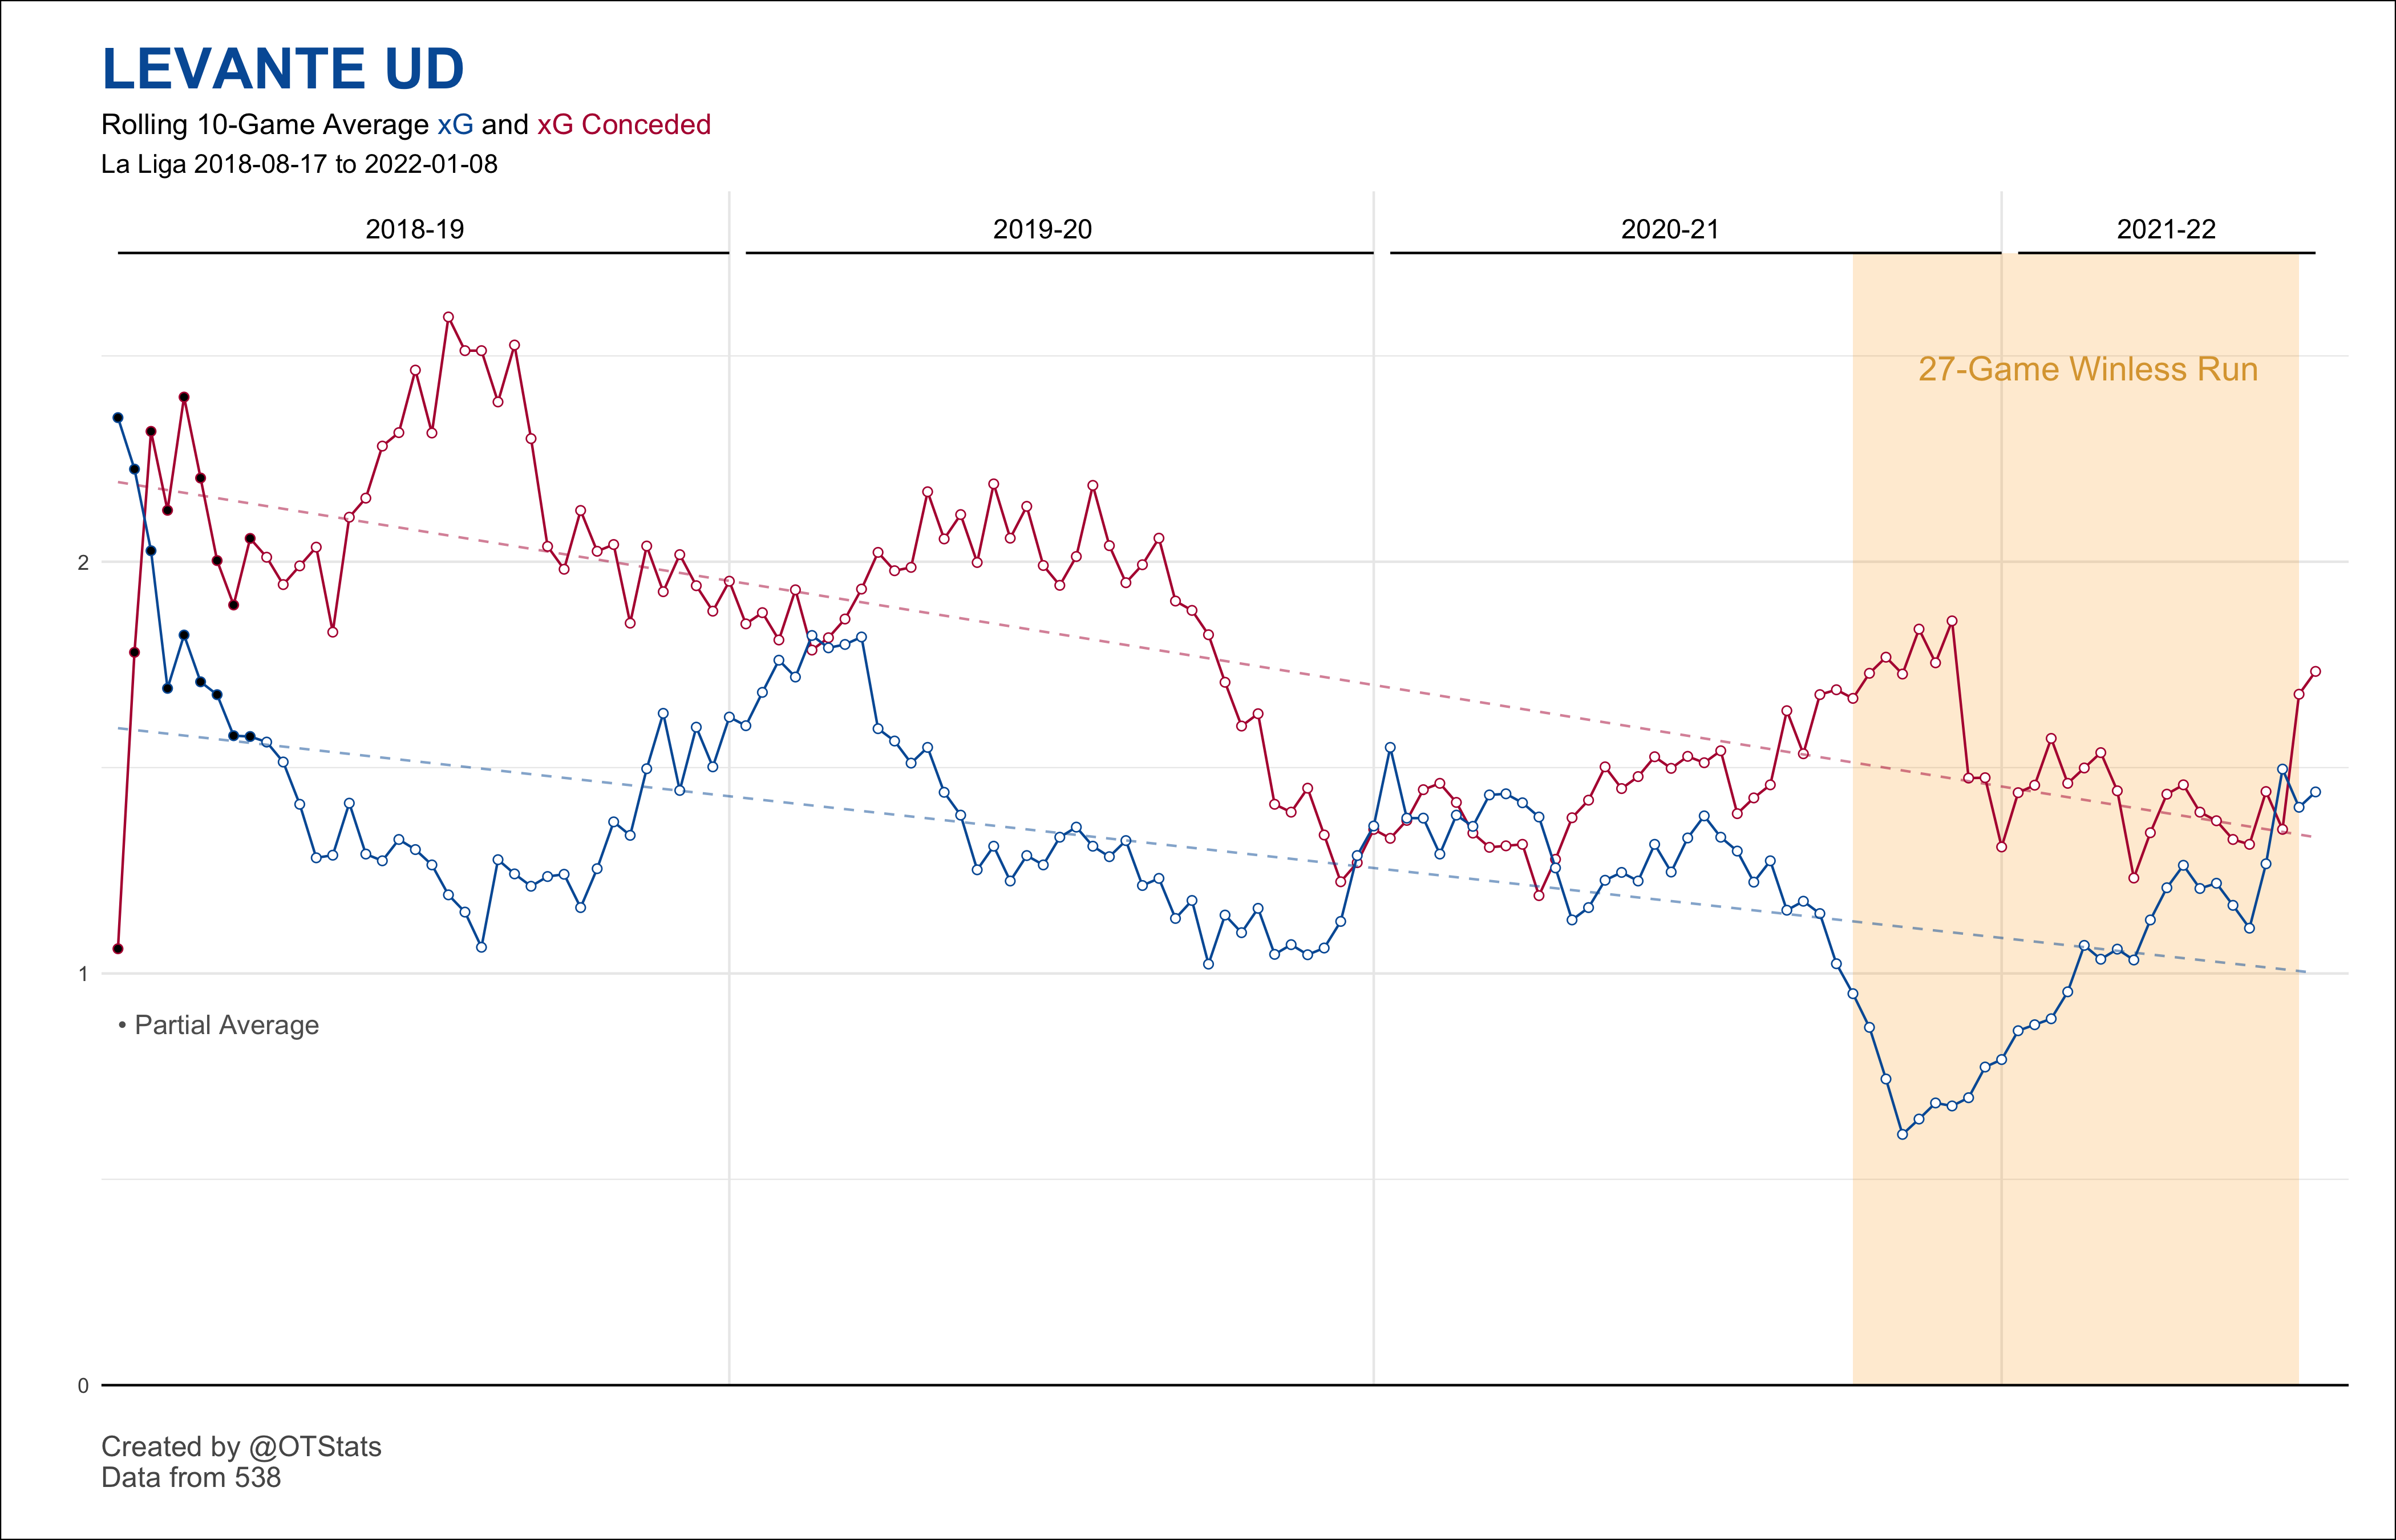
| labs(title = "LEVANTE UD ", | |
| subtitle = str_c("<span style='font-size:12pt'>Rolling 10-Game Average <span style='color:#005ca5;'>xG</span> | |
| and <span style='color:#b4053f;'>xG Conceded</span> | |
| </span><br>La Liga ", min(levante$date), " to ", max(levante$date)), | |
| caption = "Created by @OTStats\nData from 538", | |
| x = "", | |
| y = "") + | |
| theme(plot.title = element_text(size = 24, | |
| # family = "borg", # errrm.. no | |
| color = "#005ca5", | |
| face = "bold", | |
| lineheight = 1.5), | |
| plot.subtitle = element_markdown(lineheight = 1.5), | |
| plot.caption = element_text(size = 12, hjust = 0, color = "grey34"), | |
| axis.text.x = element_blank(), | |
| axis.line.x = element_line(color = "black"), | |
| plot.margin = margin(20, 20, 20, 20)) | |
| # -- Save plot | |
| ggsave(filename = "20220118-levante-xg.png", width = 14, height = 9) | |
Author
OTStats
commented
Jan 19, 2022
Sign up for free
to join this conversation on GitHub.
Already have an account?
Sign in to comment