This gist answers a Discord question. It explains my approach to collecting CPU temperatures by sending the data as an MQTT payload.
I like to think of this approach as working with the MING (Mosquitto, InfluxDB, Node-RED, Grafana) paradigm rather than fighting against it (eg using approaches like SSH calling out of the Node-RED container).
The approach is not tied to the Raspberry Pi that is running IOTstack. If you have several Raspberry Pis, they can all log their temperatures to the Raspberry Pi running IOTstack using exactly the same mechanism.
The concept can also be extended to other types of computer. I'm using it to collect CPU temperatures for macOS systems too.
Be very careful about copying and pasting text from this gist. Unless you take precautions, Windows will add its CR+LF line-endings and those will cause problems.
-
Assumed path name:
~/.local/bin/publish_rpi_temperature -
Script content:
 #!/usr/bin/env bash

 mkdir -p ~/Logs

 mosquitto_pub -h mosquitto.mydomain.com -t "/mytopic/computer/pi" -m "{\
 \"host\": \"$HOSTNAME\", \
 \"temp\": $(vcgencmd measure_temp | cut -c 6-9)\
 }"
The script assumes the Mosquitto clients are installed:
$ sudo apt install mosquitto-clients
You will need to customise:
- The target host "mosquitto.mydomain.com" using the fully-qualified domain name, or host name, or multicast DNS name, or IP address of the Raspberry Pi running IOTstack.
- The topic "/mytopic/computer/pi". Although I did not need to use it, I originally added the "/pi" suffix to the topic string in case I needed to know the type of computer that had generated the payload. My Raspberry Pi's use "/pi"; my macOS machines "/mac".
This script is specific to the Raspberry Pi. To port the script to a different type of host you will need to:
- find an alternative for
vcgencmd; and - make sure that the HOSTNAME environment variable contains a sensible value (eg on macOS, it contains the fully-qualified domain name rather than the host name).
The MQTT messages sent by this script look like this:
/mytopic/computer/mac {"host": "bauxite", "temp": 46.5}
/mytopic/computer/mac {"host": "magnetite", "temp": 28.8}
/mytopic/computer/mac {"host": "gravel", "temp": 35.2}
/mytopic/computer/mac {"host": "marble", "temp": 34.2}
/mytopic/computer/pi {"host": "octopi", "temp": 41.3}
/mytopic/computer/pi {"host": "new-dev", "temp": 43.3}
/mytopic/computer/pi {"host": "iot-hub", "temp": 46.2}
/mytopic/computer/pi {"host": "sec-dev", "temp": 45.2}
$ mkdir -p ~/LogsThe collection script does not normally produce output unless there is an error condition. If the script does not appear to be working, the place to start looking is:
$ tail ~/Logs/publish_rpi_temperature.log
-
Preamble (should be common to all crontab files):
 SHELL=/bin/bash
 HOME=/home/pi
 PATH=/home/pi/.local/bin:/usr/local/sbin:/usr/local/bin:/usr/sbin:/usr/bin:/sbin:/bin
-
Event trigger:
 # report system temperature every 5 minutes
 */5	*	*	*	*	publish_rpi_temperature >>./Logs/publish_rpi_temperature.log 2>&1
The InfluxDB database needs to be initialised before you can write to it. In this example, the database name is "computer".
$ docker exec -it influxdb influx
> create database computer
> exit
$
Within the "computer" database, each host computer logging temperatures generates its own series:
temperature,system=«hostname»
where "«hostname»" corresponds with the "host" key in the MQTT payload.

A Node-RED three-node flow handles the messages:
-
an MQTT-in node subscribing to the appropriate topic. In this example the topic is "/mytopic/computer/+" where "+" is a single-level wildcard.
-
a Change node to prepare the payload for insertion into InfluxDB:
 [
     {
         "temp": payload.temp
     },{
         "system": payload.host
     }
 ]
In words:
- temperature is added as a field (data);
- the name of the host reporting the temperature is added as a tag (metadata)
-
an InfluxDB-out node inserts the prepared payload into the database named "computer".
Given the incoming MQTT message:
/mytopic/computer/pi {"host": "iot-hub", "temp": 46.2}
The overall effect of the flow is:
> USE computer
> INSERT temperature,system='iot-hub' temp=46.2
> exit
You should be able to copy the JSON content below and use the "Import" command in the main menu (three horizontal bars "≡" at the top, right of the Node-Red window) to create a new flow containing the three nodes.
Depending on how your system is set up, the flow may need some tinkering before it works.
[
    {
        "id": "cc5ffba5.fdc7c8",
        "type": "tab",
        "label": "CPU Temperatures",
        "disabled": false,
        "info": ""
    },
    {
        "id": "796d8452.225294",
        "type": "change",
        "z": "cc5ffba5.fdc7c8",
        "name": "prepare fields",
        "rules": [
            {
                "t": "set",
                "p": "payload",
                "pt": "msg",
                "to": "[\t    {\t        \"temp\": payload.temp\t    },{\t        \"system\": payload.host\t    }\t]\t",
                "tot": "jsonata"
            }
        ],
        "action": "",
        "property": "",
        "from": "",
        "to": "",
        "reg": false,
        "x": 340,
        "y": 100,
        "wires": [
            [
                "d27128f3.4050c8"
            ]
        ]
    },
    {
        "id": "d27128f3.4050c8",
        "type": "influxdb out",
        "z": "cc5ffba5.fdc7c8",
        "influxdb": "626e8bc5.4c702c",
        "name": "write to InfluxDB",
        "measurement": "temperature",
        "precision": "",
        "retentionPolicy": "",
        "database": "",
        "retentionPolicyV18Flux": "",
        "org": "",
        "bucket": "",
        "x": 570,
        "y": 100,
        "wires": []
    },
    {
        "id": "39543010.e0258",
        "type": "mqtt in",
        "z": "cc5ffba5.fdc7c8",
        "name": "/mytopic/computer/+",
        "topic": "/mytopic/computer/+",
        "qos": "2",
        "datatype": "json",
        "broker": "c5d29fb5.89907",
        "x": 130,
        "y": 100,
        "wires": [
            [
                "796d8452.225294"
            ]
        ]
    },
    {
        "id": "626e8bc5.4c702c",
        "type": "influxdb",
        "hostname": "influxdb",
        "port": "8086",
        "protocol": "http",
        "database": "computer",
        "name": "",
        "usetls": false,
        "tls": "",
        "influxdbVersion": "1.x"
    },
    {
        "id": "c5d29fb5.89907",
        "type": "mqtt-broker",
        "name": "Docker MQTT",
        "broker": "mosquitto",
        "port": "1883",
        "clientid": "",
        "usetls": false,
        "compatmode": false,
        "protocolVersion": 4,
        "keepalive": "60",
        "cleansession": true,
        "birthTopic": "",
        "birthQos": "0",
        "birthRetain": "false",
        "birthPayload": "",
        "closeTopic": "",
        "closeQos": "0",
        "closeRetain": "false",
        "closePayload": "",
        "willTopic": "",
        "willQos": "0",
        "willRetain": "false",
        "willPayload": ""
    }
]$ docker exec -it influxdb influx -precision=rfc3339
Connected to http://localhost:8086 version 1.8.9
InfluxDB shell version: 1.8.9
> use computer
Using database computer
> show series
key
---
temperature,system=bauxite
temperature,system=gravel
temperature,system=iot-hub
temperature,system=magnetite
temperature,system=marble
temperature,system=new-dev
temperature,system=octopi
temperature,system=sec-dev
temperature,system=sjgair
> select * from temperature where time > now() - 10m tz('Australia/Sydney')
name: temperature
time system temp
---- ------ ----
2021-08-22T23:40:00.271972208+10:00 marble 35.2
2021-08-22T23:40:00.674021388+10:00 magnetite 29.6
2021-08-22T23:40:00.937395236+10:00 gravel 36.6
2021-08-22T23:40:01.065496792+10:00 bauxite 46
2021-08-22T23:40:01.220100822+10:00 sec-dev 46.7
2021-08-22T23:40:01.87568606+10:00 iot-hub 47.7
2021-08-22T23:40:01.892511832+10:00 octopi 40.8
2021-08-22T23:40:02.021640681+10:00 new-dev 42.8
2021-08-22T23:45:00.210631999+10:00 magnetite 28.9
2021-08-22T23:45:00.453033759+10:00 gravel 35.6
2021-08-22T23:45:00.545580449+10:00 bauxite 46.4
2021-08-22T23:45:00.840558319+10:00 marble 35.6
2021-08-22T23:45:01.133290607+10:00 new-dev 43.3
2021-08-22T23:45:01.319572925+10:00 sec-dev 46.2
2021-08-22T23:45:01.977801647+10:00 iot-hub 46.7
2021-08-22T23:45:01.99638355+10:00 octopi 41.3
> exit
$Shows a mixture of Raspberry Pi and macOS CPU temperatures.

I had the Sonoff POW from a couple years ago - never got it working with EspEasy firmware.
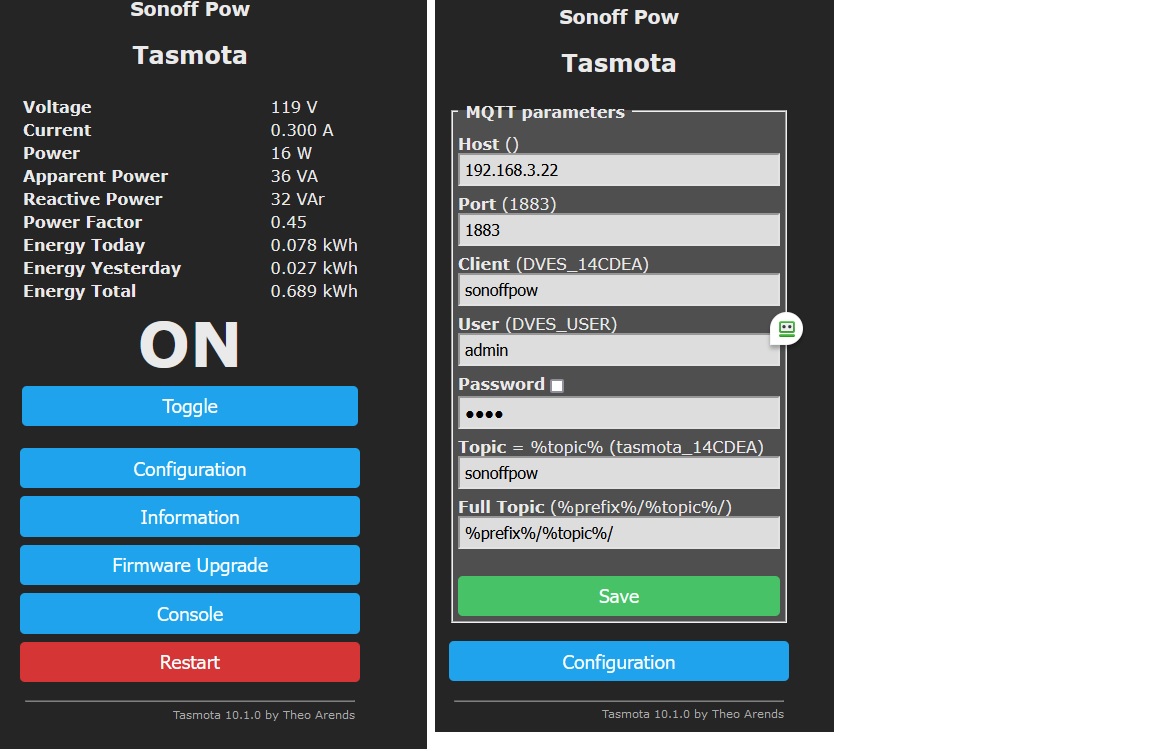
The other day I got the Sonoff POW out and flashed it with Tasmota and it works !
It has the regular display screen with all the power data and also the on off toggle.
Then the Tasmota has setup screens for MQTT and other things - really nice setup.
I have already been using it with plugs installed on it to test various AC circuits and see what is going on with loads. Pretty nice for $10. I just ordered two more of their revised POW R2 which I guess is a bit better .
Regarding the Node Red flow I have - it is a hodge podge of downloading the flows of other people and then trying to modify them to work.
And I know what you mean about getting corrupted flows - some people have some posted and I can't get them to load and spent time trying to figure out syntax errors, etc.
So now I am going to spend some time studying the flow which you kindly made and shared with me . I do appreciate it . After spending days reading up on this and that what you shared should make some sense to me - I hope !
Here are screen shots from the Tasmota webpage installed in the Sonoff POW.