The fields in this DB are:
| Field | Type | Description |
|---|---|---|
| public_key | string | The public key of the node performing the relays. |
| chain | string | The served chain code. |
| session_key | string | The session key, unique identifier of the app requesting the relays. |
| session_height | int | Starting block of the session. Nearest session start block can be computed as: (current_block - (current_block%4) )+1 |
| region | string | AWS region of the gateway requesting the relays. |
| address | string | The address of the node performing the relays. |
| total_success | int | Number of successfull relays performed by the node in the given session. |
| total_failure | int | Number of failed relays performed by the node in the given session. |
| median_success_latency | float array | Each element is the median of the relay latency at the time of the snapshot (see details below). |
| weighted_success_latency | float array | (vector) Each element is the weighted sum used by the CP at the time of the snapshot (see details below). |
| avg_success_latency | float | Mean of the median_success_latency field. |
| avg_weighted_success_latency | float | Mean of the weighted_success_latency field. |
| p_90_latency | float array | Each element is the p90 of the observed relay latencies at the time of the snapshot (see details below). |
| attempts | int array | Each element is the number of samples in the CP buffer at the time of the snapshot (see details below). |
| success_rate | float array | Each element is the proportion of successfull meassurements for the current node at the time of the snapshot (see details below). |
| failure | bool | Failure state of the node in the given session. |
The Cherry Picker (CP) metrics (median_success_latency, weighted_success_latency and p_90_latency) are calculated using a buffer wich is filled during the session. The number of samples used for computing these metrics can be obtained by:
computedSamples = success_rate * attempts
The depth of the CP buffer is capped at 500, however this is a soft cap, regulated by a function wich checks the current depth of the CP buffer and drops the oldest half of the buffer content. On top of this the Cherry Picker Snapshot (CPS) process is working. The CPS is in charge of writing the DB and it runs once every 5 minutes. When the CPS triggers it takes the state of the CP and saves it to the DB. Each snapshot is done asyncronically with the CP, an it takes the values as the are from the CP. No other computation is performed.
Due to the behaviour of the CP and the CPS, the samples written to the metrics vectors (median_success_latency, weighted_success_latency and p_90_latency) can share all, some or none data with other values in the vector (they can or cannot be correlated). To illustrate this process observe the following examples. For simplicity we consider success_rate==1 in all examples below, so the blue lines can be interpreted as the value of in the attempts field.
This case can be described with the following figure:

The number of samples in the CP buffer is shown as the blue line, growing constantly and allways below 500 (thi is why we cal it "slow"). The CPS snapshots are shown in green, as they are done every 5 minutes, only 12 sanpshots are expected in a full session. It can be seen that the samples used for the calculation of the CP metrics were all done using the same samples. No reduction of the buffer is performed. In this case we can expect the 12 samples in the metrics vectors written to the DB to be highly correlated. Actually the best metric will be the last, since it has more samples than any other (if the external factors can be considered contants during the session time).
This apps have traffic during some periods of the session. They make some relays, then stop for a while (more than 5 minutes) and they resume. Their behabiour can be represented by:

In this case the CP will ignore the app (and hence the CPS) and no data will be written to the DB in the first two samples. Then the App wakes-up and begins making relays, the CPS will then write values to the DB for the minutes 15, 20, 25 and 30. However, the since the App did not make any relay from minute 25 to 30, the CP erases all its data (buffer is dropped). After this point the CPS will write zeros to the DB untill new relays are made. On minute 50 the App begins to make new relays and the CP starts to fill the buffer once again and the CPS will write new values at minutes 55 and 60. In this case the metrics at minutes 15, 20, 25 and 30 will be totally correlated but uncorrelated to the metrics at minutes 55 and 60.
A normal App is one that is able to fill the buffer during a session. This can happen more than once but not more than once every 5 minutes. This particular example also includes an error in the node. The following image illustrates its behabiour:
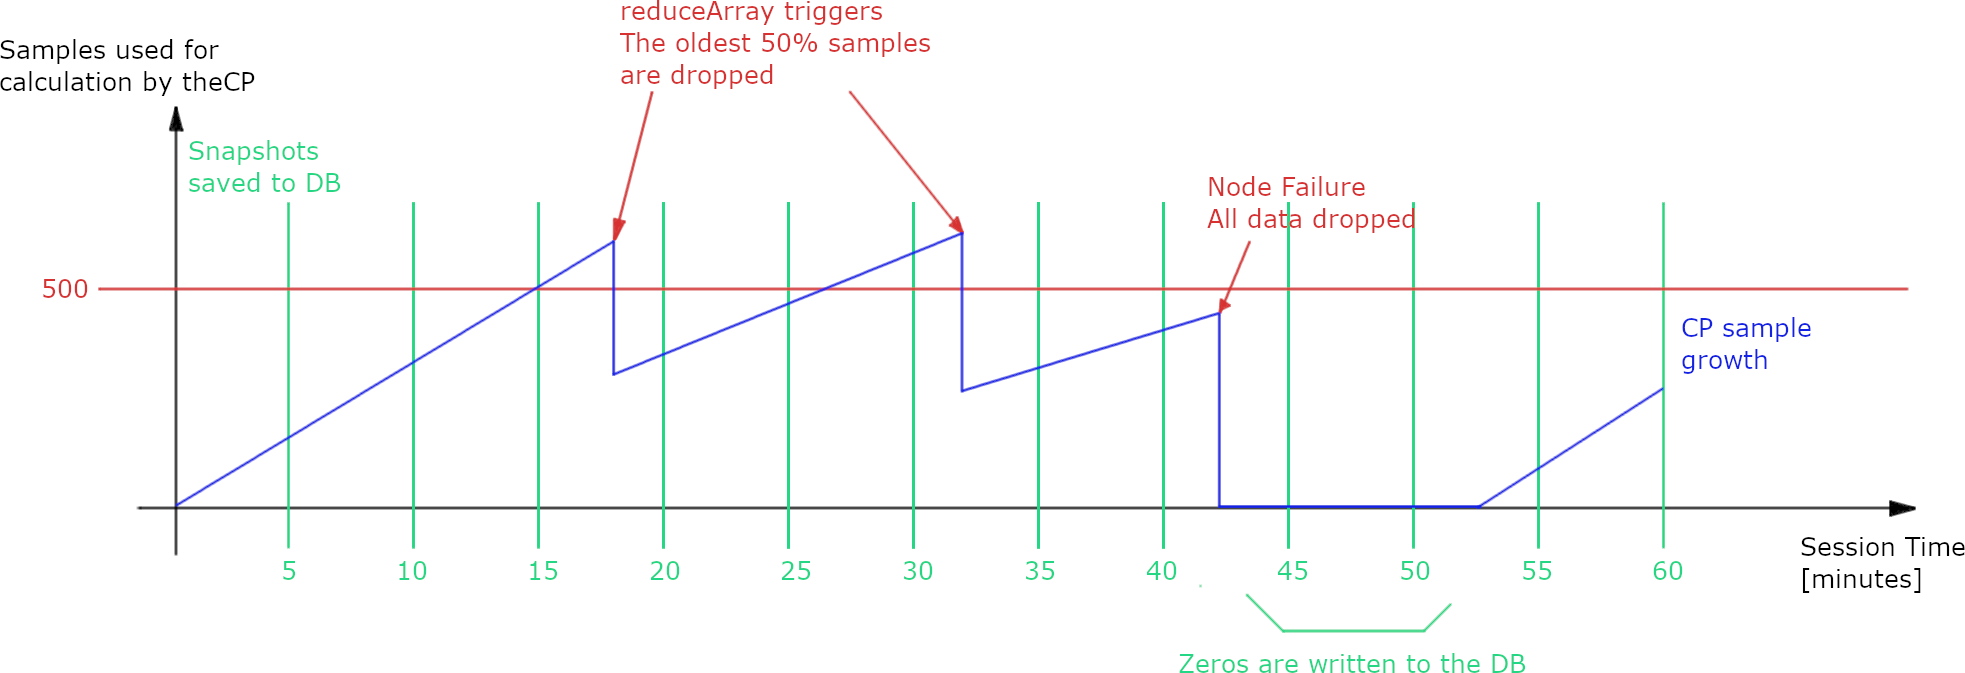
It can be seen that the CP buffer surpases the 500 samples 2 times, between the 15 and 20 minute mark and between the 30 and 35 minute mark. After the CP buffer surpases the 500 samples the reduceArray function triggers. This function drops the oldest half do the samples in the buffer. This function is triggered asyncronically, it can happen at any time after the CP buffer reached the 500 samples. An other effect is observed between minute 40 and 45 where the node receiving the relays fails and the CP drops all its data. The node is not tested for 5 mininutes. After this point the node reovers and starts performing again between minute 50 and 55.
In this case the metrics are calculated using all the samples, except in the minute 30. It can be seen that at minute 30 the CP buffer contains more than 500 samples, in this case the metrics are calculated using a subsample of 500 samples picked at random from the total samples in the CP buffer. The metrics calculated before minute 40 have different behabiours:
- From minute 5 to 15 they are all totally correlated.
- From minute 20 to 30 they are all totally correlated.
- From minute 35 to 40 they are all totally correlated.
- From minute 55 to 60 they are all totally correlated.
- From minute 20 to 30 there is some correlation to the ones between 5 and 15 and also to the ones between 35 to 40.
- The metrics from 5 to 15 are uncorrated to the ones from 35 to 40. After two halvings all the old samples are flushed.
- The metrics at 55 and 60 minutes are uncorrelated to the rest.
These Apps perform a large number of relays, filling the buffer more than once every 5 minutes. The CP buffer behaviour is shown in the following figure:

It can be seen that the buffer grows too fast and that the reduceArray function is triggered frequently (red square marks). Since the reduceArray does not manage to keep the CP buffer below 500 it can begin to grow over this value (from minutes 15 to 20). In this example the App stops making relays after minute ~33.
Here all the metrics will be uncorrelated, since they are computed with completelly different sets of samples each time the CPS triggered (except the sample at minute 30). Each of these metrics are computed with only 500 sampels, randomly sampled from the full CP buffer. The metrics after minute 35 will all be zeros.