- Code to be changed based on filtering criteria of the file
library(stringr)

rPath <- "C:/folder/"
rFlist <- list.files(path = rPath, pattern = "*.txt")         # get txt files list
rFileName <- str_subset(rFlist, max(str_sub(rFlist, 0,14)))   # do the filtering based on filename...
                                                              #(need to change based on requirement)
rFile = paste0(rPath, rFileName)                              # full file name to process further
#' @param fpath file path zip file (absolute or relative, including file name)
  file_ls <- as.character(unzip(fpath,list = TRUE)$Name)

  readr::read_delim(unz(fpath, file_ls),"\t", escape_double = FALSE, trim_ws = TRUE, col_types = "ccccccccccddcddccccddccddccc")
- extract the date from the filename (that includes date)
e.g filename-09-09-2018.csv
file <- list.files(path = ph1path, pattern = "*.csv")

dateImported <- str_extract(file, pattern = "\\d\\d-\\d\\d-\\d\\d\\d\\d")
http://www.sthda.com/english/wiki/ggplot2-barplot-easy-bar-graphs-in-r-software-using-ggplot2
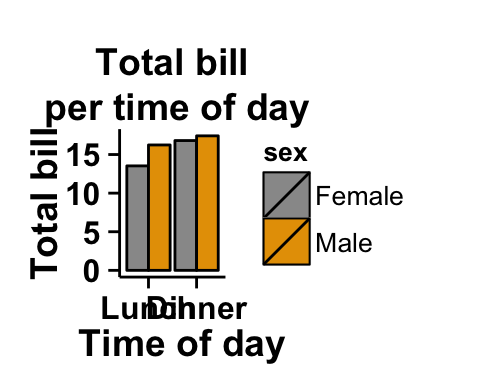
data set head
##      sex   time total_bill
## 1 Female  Lunch      13.53
## 2 Female Dinner      16.81
## 3   Male  Lunch      16.24
## 4   Male Dinner      17.42
code
# Stacked barplot
# Plot of variable 'total_bill' according to xName 'time'.
# The plot is colored by the groupName 'sex'
ggplot2.barplot(data=df1, xName='time', yName="total_bill",
                groupName='sex')
# Use position=position_dodge()
ggplot2.barplot(data=df1, xName='time', yName="total_bill",
         groupName='sex', position=position_dodge())
# change colors
ggplot2.barplot(data=df1, xName='time', yName="total_bill",
      groupName='sex', groupColors=c('#999999','#E69F00'),
      position=position_dodge(),
      #background and line colors
      backgroundColor="white", color="black",
      xtitle="Time of day", ytitle="Total bill",
      mainTitle="Total bill\n per time of day",
      removePanelGrid=TRUE,removePanelBorder=TRUE,
      axisLine=c(0.5, "solid", "black")
      )
SELECT ABS(CAST(CAST(NEWID() AS VARBINARY) AS INT)) AS [RandomNumber]
Example:
SELECT TOP 10 ABS(CAST(CAST(NEWID() AS VARBINARY) AS INT)) AS [RandomNumber],
       [CustomerID], [CompanyName], [ContactName]
FROM [dbo].[Customers]
andomNumber CustomerID CompanyName                              ContactName
------------ ---------- ---------------------------------------- -------------------
1120919216   ALFKI      Alfreds Futterkiste                      Maria Anders
1227765350   ANATR      Ana Trujillo Emparedados y helados       Ana Trujillo
677704826    ANTON      Antonio Moreno Taquería                  Antonio Moreno
151612960    AROUT      Around the Horn                          Thomas Hardy
755868329    BERGS      Berglunds snabbköp                       Christina Berglund
1566550720   BLAUS      Blauer See Delikatessen                  Hanna Moos
1511953511   BLONP      Blondesddsl père et fils                 Frédérique Citeaux
1280157238   BOLID      Bólido Comidas preparadas                Martín Sommer
1283976604   BONAP      Bon app'                                 Laurence Lebihan
989554291    BOTTM      Bottom-Dollar Markets                    Elizabeth Lincoln
(http://www.sql-server-helper.com/tips/generate-random-numbers.aspx)
(https://www.goodly.co.in/split-by-variable-columns-in-power-query/)
let
  Source = Excel.CurrentWorkbook(){[Name = "Data"]}[Content],
  DynamicColumnList = List.Transform({
    1..List.Max(
      Table.AddColumn(Source, "Custom", each List.Count(
        Text.PositionOfAny([Hobbies], {","}, Occurrence.All)
      ))[Custom]
    ) + 1
  }, each "Hobbies." & Text.From(_)),
  #"Split Column by Delimiter" = Table.SplitColumn(
    Source,
    "Hobbies",
    Splitter.SplitTextByDelimiter(",", QuoteStyle.Csv),
    DynamicColumnList
  )
in
  #"Split Column by Delimiter"
Updated on read zip files