-
-
Save StewSchrieff/d336b17650b8199f619a7313d5839ca3 to your computer and use it in GitHub Desktop.
| import numpy as np | |
| import matplotlib.pyplot as plt | |
| # Note that each inning is independent, so we only need to simulate one inning at a time | |
| moonwalkers = { | |
| 'name': "Mississippi Moonwalkers", | |
| 'color': 'blue', | |
| 'avoidStrikeout': 0.4, # Chance of "success" at bat | |
| 'numBasesOnHit': 1 | |
| } | |
| doubloons = { | |
| 'name': "Delaware Doubloons", | |
| 'color': 'red', | |
| 'avoidStrikeout': 0.2, # Chance of "success" at bat | |
| 'numBasesOnHit': 2 | |
| } | |
| taters = { | |
| 'name': "Tennessee Taters", | |
| 'color': 'green', | |
| 'avoidStrikeout': 0.1, # Chance of "success" at bat | |
| 'numBasesOnHit': 4 # where four bases is a home run | |
| } | |
| teams = [] | |
| teams.append(moonwalkers) | |
| teams.append(doubloons) | |
| teams.append(taters) | |
| def moveBases(num_bases, bases, runs): | |
| # where bases is a list of 0s and 1s of length 3 - simulating "runners" on bases | |
| # Move the baseRunners | |
| i = 2 | |
| for runner in bases[::-1]: | |
| # Loop through the bases backwards, and move each runner forward by num_bases | |
| if (runner == 1): | |
| # Advance the runner | |
| new_base = i + num_bases | |
| if (new_base > 2): | |
| runs += 1 | |
| # print('run scored! Woohoo') | |
| else: | |
| bases[new_base] = 1 | |
| bases[i] = 0 # Move the runner off of the base he was on | |
| i -= 1 | |
| # Move the batter | |
| if num_bases < 3: | |
| bases[num_bases - 1] = 1 | |
| else: | |
| # Is a home run | |
| runs += 1 | |
| # print(bases) | |
| return bases, runs | |
| ### Simulate an inning | |
| def simulate_inning(team): | |
| inning_score = 0 | |
| bases = [0,0,0] | |
| runs = 0 | |
| outs = 0 | |
| while outs in range(0,3): | |
| if (bool(np.random.binomial(1, team['avoidStrikeout']))): | |
| bases, runs = moveBases(team['numBasesOnHit'], bases, runs) | |
| else: | |
| # print('strikeout') | |
| outs += 1 | |
| # print(f"End of inning. \nRuns Scored: {runs}") | |
| return runs | |
| def plot_inning_statistics(num_innings): | |
| fig = plt.figure() | |
| ax = fig.add_subplot(111) | |
| for team in teams: | |
| scores = [] | |
| for i in range(1, num_innings): | |
| scores.append(simulate_inning(moonwalkers)) | |
| print(f'{team["name"]}The average runs scored in an inning is : {sum(scores) / len(scores)}') | |
| ax.hist(scores, bins=max(scores), normed=True, edgecolor="None", alpha=0.2, color=team['color']) | |
| ax.hist(scores, bins=max(scores), normed=True, ls='dashed', lw=3, facecolor="None") | |
| # plt.title(f"{team['name']}'s Distribution of Runs Per Inning") | |
| # ax.xlabel("Runs scored") | |
| # ax.ylabel("Probablity") | |
| # plt.show() | |
| plt.show() | |
| def simulate_game(teamA, teamB): | |
| #Simulates a single game between two teams passed in | |
| a_score = 0 | |
| b_score = 0 | |
| # Always simulate 9 innings, then need to check if the score is tied | |
| for i in range(1, 10): | |
| a_score += simulate_inning(teamA) | |
| b_score += simulate_inning(teamB) | |
| while a_score == b_score: | |
| # Continue to simulate extra innings until the score is not tied | |
| a_score += simulate_inning(teamA) | |
| b_score += simulate_inning(teamB) | |
| win_margin = max(a_score, b_score) - min(a_score, b_score) | |
| winner = teamA if (a_score > b_score) else teamB | |
| return winner, win_margin | |
| def simulate_season(num_rounds): | |
| moonwalkers_wins = 0 | |
| taters_wins = 0 | |
| doubloons_wins = 0 | |
| moonwalkers_losses = 0 | |
| taters_losses = 0 | |
| doubloons_losses = 0 | |
| moonwalkers_win_margin = 0 | |
| taters_win_margin = 0 | |
| doubloons_win_margin = 0 | |
| moonwalkers_victory_margin = 0 | |
| taters_victory_margin = 0 | |
| doubloons_victory_margin = 0 | |
| moonwalkers_loss_margin = 0 | |
| taters_loss_margin = 0 | |
| doubloons_loss_margin = 0 | |
| num_games = 0 | |
| for i in range(0, num_rounds): | |
| num_games += 1 | |
| winner, win_margin = simulate_game(doubloons, moonwalkers) | |
| if winner == moonwalkers: | |
| moonwalkers_wins += 1 | |
| doubloons_losses += 1 | |
| moonwalkers_victory_margin += win_margin | |
| doubloons_loss_margin += -win_margin | |
| moonwalkers_win_margin += win_margin | |
| doubloons_win_margin += -win_margin | |
| else: | |
| doubloons_wins += 1 | |
| moonwalkers_losses += 1 | |
| doubloons_victory_margin += win_margin | |
| moonwalkers_loss_margin += -win_margin | |
| doubloons_win_margin += win_margin | |
| moonwalkers_win_margin += -win_margin | |
| num_games += 1 | |
| winner, win_margin = simulate_game(taters, moonwalkers) | |
| if winner == moonwalkers : | |
| moonwalkers_wins += 1 | |
| taters_losses += 1 | |
| moonwalkers_victory_margin += win_margin | |
| taters_loss_margin += -win_margin | |
| moonwalkers_win_margin += win_margin | |
| taters_win_margin += -win_margin | |
| else: | |
| taters_wins += 1 | |
| moonwalkers_losses += 1 | |
| taters_victory_margin += win_margin | |
| moonwalkers_loss_margin += -win_margin | |
| taters_win_margin += win_margin | |
| moonwalkers_win_margin += -win_margin | |
| num_games += 1 | |
| winner, win_margin = simulate_game(taters, doubloons) | |
| if winner == taters: | |
| taters_wins +=1 | |
| doubloons_losses += 1 | |
| taters_victory_margin += win_margin | |
| doubloons_loss_margin += -win_margin | |
| taters_win_margin += win_margin | |
| doubloons_win_margin += -win_margin | |
| else: | |
| doubloons_wins += 1 | |
| taters_losses += 1 | |
| doubloons_victory_margin += win_margin | |
| taters_loss_margin += -win_margin | |
| doubloons_win_margin += win_margin | |
| taters_win_margin += -win_margin | |
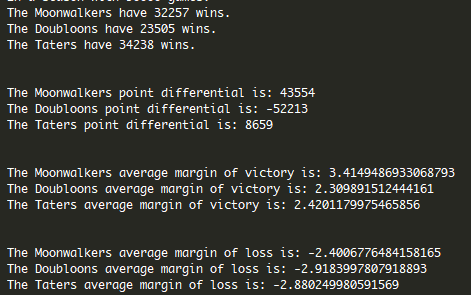
| print(f"In a season with {num_games} games:") | |
| print(f"The Moonwalkers have {moonwalkers_wins} wins.") | |
| print(f"The Doubloons have {doubloons_wins} wins.") | |
| print(f"The Taters have {taters_wins} wins.\n\n") | |
| print(f"The Moonwalkers point differential is: {moonwalkers_win_margin}") | |
| print(f"The Doubloons point differential is: {doubloons_win_margin}") | |
| print(f"The Taters point differential is: {taters_win_margin}\n\n") | |
| print(f"The Moonwalkers average margin of victory is: {moonwalkers_victory_margin / moonwalkers_wins}") | |
| print(f"The Doubloons average margin of victory is: {doubloons_victory_margin / doubloons_wins}") | |
| print(f"The Taters average margin of victory is: {taters_victory_margin / taters_wins}\n\n") | |
| print(f"The Moonwalkers average margin of loss is: {moonwalkers_loss_margin / moonwalkers_losses}") | |
| print(f"The Doubloons average margin of loss is: {doubloons_loss_margin / doubloons_losses}") | |
| print(f"The Taters average margin of loss is: {taters_loss_margin / taters_losses}") | |
| if __name__ == '__main__': | |
| simulate_season(30000) | |
| # plot_inning_statistics(3000000) |
I thought the Taters' expected value of runs per inning was 0.1*3 / 0.9 = 0.3333, while the Moonwalkers' expected value was slightly higher, at 0.3739, which I calculated via simulation.
It was one of the things that surprised me - the higher expected runs per inning didn't translate directly into more wins, because the Taters seemed to win more low-scoring games. Am I missing something about how you calculated your average values?
Two thoughts:
- As with any Monte Carlo style simulation, there's a good bit of random variance that the simulation is attempting to account for simply by increasing the sample size. For this level of precision, it seems like my sample size is too small to precisely measure the expected value. I've re-run my simulation a few times and am varying too much to make a definitive conclusion.
Because I'm too lazy to perform code optimizations, I bumped up the innings again (now 3000000 innings per team) and found the following, more precise, expected values:
- Tennessee Taters: 0.3734671244890415
- Mississippi Moonwalkers: 0.37445745815248604
- Delaware Doubloons: 0.37325179108393036
So it looks like the Moonwalkers actually DO have a higher expected value (an observation not consistent with my first run of the simulation).
And now I'm questioning everything
- I think the calculation of
0.1*3 / 0.9 = 0.3333is not completely correct. The situation described by this formula leaves out the fact that if a Tater does hit a homer, then another Tater will be able to step up to the bat. So the actual expected runs per inning for the Taters must be greater than 0.33333...
And now I'm questioning everything
😆
- I think the calculation of
0.1*3 / 0.9 = 0.3333is not completely correct. The situation described by this formula leaves out the fact that if a Tater does hit a homer, then another Tater will be able to step up to the bat. So the actual expected runs per inning for the Taters must be greater than 0.33333...
The formula is the mean of a negative binomial distribution. If you do the same thing "by hand" it would be the sum of comb(runs + 2, runs)*0.9**3*0.1**runs for runs in [0, inf]. You can get pretty close to the limit with the first 5 elements, because the probabilities get very small very quickly.
>>> expected_value = (
    0 * 0.9**3
    + 1 * 3 * 0.9**3 * 0.1**1
    + 2 * 6 * 0.9**3 * 0.1**2
    + 3 * 10 * 0.9**3 * 0.1**3
    + 4 * 15 * 0.9**3 * 0.1**4
)
>>> expected_value
0.33242400000000005Ah, I see what you mean with classifying this as a negative binomial problem. Thanks for the clear explanation! Interesting that the numpy line (line 67) I call is the binomial distribution. That is, I used statistics to get the probability of successes, and then used code to handle the failures, while I could have used statistics to model the failures as well. Guess that's why I'm a software engineer rather than a statistician :)
Here's another writeup that addresses the negative binomial distribution as a statistical approach to this problem. I'm not incredibly familiar with R, so I don't quite understand everything, but it appears like Stephen Penrice is able to use negative binomial distribution to also model the Moonwalkers.
Looks like his explanation is that the Taters are less likely to get shut out in a game:
The Taters are most likely to have the best record for the season. They get shut out much less often (less than 6% of their games versus more than 16% for the others), and this outweighs the fact that the Moonwalkers, on average, score more runs per 9 innings.
This conclusion would contradict my original conclusion that the only statistic that matters is the expected runs per inning. It appears as though because baseball games are so "short" (only 9 innings, rather than thousands of innings), the clustering of the runs is detrimental to the Moonwalkers. It would seem that the Moonwalkers are more likely to blow opponents out of the water, while the taters are more likely to "squeak out" wins.
It would seem that the Moonwalkers are more likely to blow opponents out of the water, while the taters are more likely to "squeak out" wins.
That's what I was thinking! For what it's worth I did a write-up as well, which might help clarify my snippets above.
I've modified my code above to now spit out some "in-game" statistics and it appears that my simulation confirms most of what you say in your blog post/above. The Moonwalkers have the highest average margin of victory, but this doesn't translate to more wins.
Nice investigation!
Riddler League Baseball Simulation
I wrote a python simulation, that will simulate any number of games between our three Riddler League Baseball teams. In order to return in a timely fashion, I simulated that involves 90000 games in total, with each team playing the other two teams an equal number of times.
These results can be distilled down to a simple statistic by recognizing the following: For a given team A, there is no impact on team A's offensive performance when Team B changes. There is no concept of defense contributing to wins in this universe. Knowing this, Team A will play with the same batting probabilities against Team B and C. Each game is independent. Furthermore, each inning is independent. Because of this, the most important statistic in this scenario is the expected value of runs scored per inning.
I calculated the average runs scored per inning over 300000 innings for each team. This yielded the following values:
This statistic is sufficient to conclude that the Taters will have the most wins, due to the constraints outlined above. Turns out, offense does actually win games.