Sample of using geojson-vt generated tiles inside leaflet 0.7. It uses custom (generic) TiledCanvas L.CanvasTiles.js .
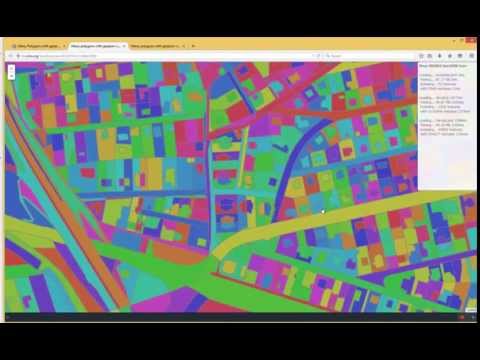
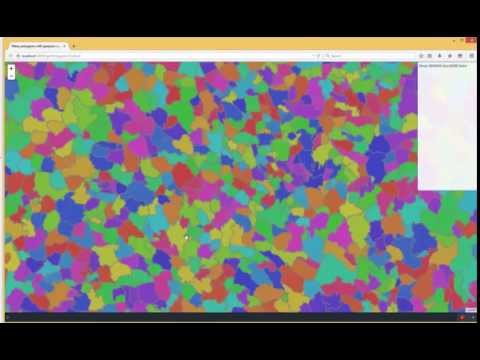
info also here
| <!doctype html> | |
| <html> | |
| <head> | |
| <title>Many polygons with geojson-vt on Leaflet</title> | |
| <meta charset="utf-8"> | |
| <style> | |
| html, body { | |
| height: 100%; | |
| padding: 0; | |
| margin: 0; | |
| background: rgb(14, 21, 30); | |
| height: 100%; | |
| font-family: Tahoma, Geneva, Verdana, sans-serif; | |
| font-size:12px; | |
| color:#808080; | |
| } | |
| #map { | |
| position: absolute; | |
| height: 100%; | |
| width: 100%; | |
| background-color: #333; | |
| } | |
| </style> | |
| </head> | |
| <body> | |
| <div id="map"></div> | |
| <div id="drop" style="position:absolute; right:0px; top:0px; width: 200px; height:50%;background-color: white; | |
| border-style:dashed; border-color: blue; border-width:1px; border-radius:4px;padding:5px; opacity:0.9"> | |
| <b>Drop WGS84 GeoJSON here</b> | |
| </div> | |
| <link rel="stylesheet" href="http://cdn.leafletjs.com/leaflet-0.7.2/leaflet.css" /> | |
| <script src="http://cdn.leafletjs.com/leaflet-0.7.2/leaflet.js"></script> | |
| <script src="http://www.sumbera.com/gist/js/vt/geojson-vt-dev.js"></script> | |
| <script src="http://www.sumbera.com/gist/js/leaflet/canvas/L.CanvasTiles.js"></script> | |
| <script src="http://www.sumbera.com/gist/data/CZDistricts.js"></script> | |
| <script> | |
| var leafletMap = L.map('map').setView([50.00, 14.44], 9); | |
| L.tileLayer("http://{s}.sm.mapstack.stamen.com/(toner-background,$fff[difference],$fff[@23],$fff[hsl-saturation@20],toner-lines[destination-in])/{z}/{x}/{y}.png") | |
| .addTo(leafletMap); | |
| var tileOptions = { | |
| maxZoom: 20, // max zoom to preserve detail on | |
| tolerance: 5, // simplification tolerance (higher means simpler) | |
| extent: 4096, // tile extent (both width and height) | |
| buffer: 64, // tile buffer on each side | |
| debug: 0, // logging level (0 to disable, 1 or 2) | |
| indexMaxZoom: 0, // max zoom in the initial tile index | |
| indexMaxPoints: 100000, // max number of points per tile in the index | |
| }; | |
| //------------------------------------------------- | |
| function colorizeFeatures(data) { | |
| var counter = 0; | |
| for (var i = 0; i < data.features.length; i++) { | |
| data.features[i].properties.color = 'hsl(' + 360 * Math.random() + ', 50%, 50%)'; | |
| if (data.features[i].geometry.coordinates[0]) | |
| counter += data.features[i].geometry.coordinates[0].length; | |
| else{ | |
| console.log("empty coordinates at " + i + " patching with 0.0..."); | |
| data.features[i].geometry.coordinates[0] = 0.0 | |
| data.features[i].geometry.coordinates[1] = 0.0 | |
| } | |
| } | |
| return counter; | |
| } | |
| var tileIndex = geojsonvt(data, tileOptions); | |
| var dropArea = document.getElementById('drop'); | |
| dropArea.ondragover = function () { | |
| return false; | |
| }; | |
| dropArea.ondragend = function () { | |
| return false; | |
| }; | |
| dropArea.ondrop = function (e) { | |
| // -- helper from viz.js test of geojson-vt | |
| function humanFileSize(size) { | |
| var i = Math.floor(Math.log(size) / Math.log(1024)); | |
| return Math.round(100 * (size / Math.pow(1024, i))) / 100 + ' ' + ['B', 'kB', 'MB', 'GB'][i]; | |
| } | |
| var reader = new FileReader(); | |
| reader.readAsText(e.dataTransfer.files[0]); | |
| dropArea.innerHTML += "<br/>"; | |
| dropArea.innerHTML += "<br/>Loading... " + e.dataTransfer.files[0].name.toString(); | |
| var start = new Date().getTime(); | |
| reader.onload = function (event) { | |
| var elapsed = new Date().setTime(new Date().getTime() - start); | |
| dropArea.innerHTML += " " + elapsed + "ms"; | |
| try { | |
| dropArea.innerHTML += "<br/> Parsing... " + humanFileSize(event.target.result.length); | |
| start = new Date().getTime(); | |
| var data; | |
| data = JSON.parse(event.target.result); | |
| elapsed = new Date().setTime(new Date().getTime() - start); | |
| dropArea.innerHTML += " " + elapsed + "ms"; | |
| var vertCount = colorizeFeatures(data); | |
| start = new Date().getTime(); | |
| dropArea.innerHTML += "<br/> Indexing... " + data.features.length + " features"; | |
| dropArea.innerHTML += "<br/> with " + vertCount + " vertexes"; | |
| tileIndex = geojsonvt(data, tileOptions); //eslint-disable-line | |
| elapsed = new Date().setTime(new Date().getTime() - start); | |
| dropArea.innerHTML += " " + elapsed + "ms"; | |
| tileLayer.redraw(); | |
| } catch (err) { | |
| dropArea.innerHTML += "<br/> Error: " + err; | |
| } | |
| }; | |
| e.preventDefault(); | |
| return false; | |
| }; | |
| colorizeFeatures(data); | |
| var tileLayer = L.canvasTiles() | |
| .params({ debug: false, padding: 5 }) | |
| .drawing(drawingOnCanvas) | |
| var pad = 0; | |
| tileLayer.addTo(leafletMap); | |
| function drawingOnCanvas(canvasOverlay, params) { | |
| var bounds = params.bounds; | |
| params.tilePoint.z = params.zoom; | |
| var ctx = params.canvas.getContext('2d'); | |
| ctx.globalCompositeOperation = 'source-over'; | |
| console.log('getting tile z' + params.tilePoint.z + '-' + params.tilePoint.x + '-' + params.tilePoint.y); | |
| var tile = tileIndex.getTile(params.tilePoint.z, params.tilePoint.x, params.tilePoint.y); | |
| if (!tile) { | |
| console.log('tile empty'); | |
| return; | |
| } | |
| ctx.clearRect(0, 0, params.canvas.width, params.canvas.height); | |
| var features = tile.features; | |
| ctx.strokeStyle = 'grey'; | |
| for (var i = 0; i < features.length; i++) { | |
| var feature = features[i], | |
| type = feature.type; | |
| ctx.fillStyle = feature.tags.color ? feature.tags.color : 'rgba(255,0,0,0.05)'; | |
| ctx.beginPath(); | |
| for (var j = 0; j < feature.geometry.length; j++) { | |
| var geom = feature.geometry[j]; | |
| if (type === 1) { | |
| ctx.arc(geom[0] * ratio + pad, geom[1] * ratio + pad, 2, 0, 2 * Math.PI, false); | |
| continue; | |
| } | |
| for (var k = 0; k < geom.length; k++) { | |
| var p = geom[k]; | |
| var extent = 4096; | |
| var x = p[0] / extent * 256; | |
| var y = p[1] / extent * 256; | |
| if (k) ctx.lineTo(x + pad, y + pad); | |
| else ctx.moveTo(x + pad, y + pad); | |
| } | |
| } | |
| if (type === 3 || type === 1) ctx.fill('evenodd'); | |
| ctx.stroke(); | |
| } | |
| }; | |
| </script> | |
| </body> | |
| </html> |
| Licensed under MIT | |
| Copyright (c) 2015 Stanislav Sumbera, | |
| Permission is hereby granted, free of charge, to any person obtaining a copy of this software and associated documentation files | |
| (the "Software"), to deal in the Software without restriction, including without limitation the rights to use, | |
| copy, modify, merge, publish, distribute, sublicense, and/or sell copies of the Software, | |
| and to permit persons to whom the Software is furnished to do so, subject to the following conditions: | |
| The above copyright notice and this permission notice shall be included in all copies or substantial portions of the Software. | |
| THE SOFTWARE IS PROVIDED "AS IS", WITHOUT WARRANTY OF ANY KIND, EXPRESS OR IMPLIED, | |
| INCLUDING BUT NOT LIMITED TO THE WARRANTIES OF MERCHANTABILITY, FITNESS FOR A PARTICULAR PURPOSE AND NONINFRINGEMENT. | |
| IN NO EVENT SHALL THE AUTHORS OR COPYRIGHT HOLDERS BE LIABLE FOR ANY CLAIM, DAMAGES OR OTHER LIABILITY, | |
| WHETHER IN AN ACTION OF CONTRACT, TORT OR OTHERWISE, ARISING FROM, OUT OF OR IN CONNECTION WITH THE SOFTWARE | |
| OR THE USE OR OTHER DEALINGS IN THE SOFTWARE. |
Hello @Sumbera, there is no license attach to this code, including the custom Canvas Tiles (http://www.sumbera.com/gist/js/leaflet/canvas/L.CanvasTiles.js). I would like to use it.
Can you attach one or make a statement here?
Thanks.
MIT
How can I add two separate layers using this? This is so I can toggle them on and off in the layer control. This code still seems to render better than gridlayer.
How can I highlight a polygon on click event from the tile?