Last active
July 3, 2021 03:42
-
-
Save Teque5/3a377440916506fb2ac46a9f47251da4 to your computer and use it in GitHub Desktop.
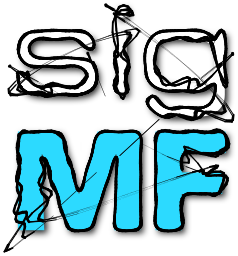
SigMF XY O-Scope Logo (.sigmf to .svg)
This file contains bidirectional Unicode text that may be interpreted or compiled differently than what appears below. To review, open the file in an editor that reveals hidden Unicode characters.
Learn more about bidirectional Unicode characters
| #!/usr/bin/env python3 | |
| '''code to render SigMF logo as nice SVG via oscillioscope''' | |
| import matplotlib.pyplot as plt | |
| import numpy as np | |
| from sigmf import sigmffile | |
| from scipy.signal import resample_poly | |
| # load data | |
| signal = sigmffile.fromfile('sigmf_logo') | |
| # signal = sigmffile.fromfile('sigmf_logo_fullband') | |
| samples = signal.read_samples(0, signal.sample_count) | |
| samp_rate = signal.get_global_field('core:sample_rate') | |
| # drawing parameters | |
| framerate = 60 | |
| frames = 6 * framerate | |
| width_decay = 4 | |
| interp = 4 if samp_rate == 48000 else 1 | |
| intensity = 1/frames * 1000 * interp | |
| if interp == 4: | |
| intensity *= 500 | |
| blocksize = int(signal.sample_count/frames) | |
| colors = plt.get_cmap('viridis')(np.linspace(0, 1, blocksize*interp)) | |
| full_scale = 10*10**(-14/10) # -14 LUFS | |
| fade = True | |
| for fdx in range(0, frames): | |
| if fdx != 244: | |
| # 244 is our logo frame at 60fps | |
| continue | |
| #if fdx*blocksize < 3.875*samp_rate: | |
| # # logo is steady in this region | |
| # continue | |
| chunk = samples[fdx*blocksize:(fdx+1)*blocksize] | |
| if interp > 1: | |
| # smooth out transitions | |
| chunk = resample_poly(chunk, interp, 1) | |
| # distance between points proportional to line width | |
| distances = np.array([np.linalg.norm(x) for x in chunk[1:]-chunk[:-1]]) | |
| points = chunk.reshape(-1, 1, 2) | |
| segments = np.concatenate([points[:-1], points[1:]], axis=1) | |
| widths = (distances.max()-distances)**width_decay * intensity | |
| if fade: | |
| # tail off intensity of oldest points | |
| # widths = widths * np.geomspace(.001, 1, num=len(widths)) | |
| glow = np.ones_like(widths) | |
| fade_count = len(glow)//4 | |
| glow[0:fade_count] = np.linspace(0,1,fade_count+1)[1:] | |
| widths *= glow | |
| # draw | |
| scale = .9 | |
| plt.figure(figsize=(9,9)) | |
| ax = plt.gca() | |
| for kdx in range(len(segments)-1): | |
| segment = segments[kdx] | |
| # was using LineCollection, but doesn't set capstyles correctly per | |
| # https://stackoverflow.com/questions/38079366/matplotlib-line3dcollection-multicolored-line-edges-are-jagged | |
| line, = ax.plot(segment[:,0], segment[:,1], color='k', linewidth=widths[kdx]) | |
| line.set_solid_capstyle('round') | |
| if fdx == 244: | |
| plt.xlim(-full_scale, full_scale) | |
| plt.ylim(-full_scale, full_scale) | |
| plt.gca().set_axis_off() | |
| #plt.savefig('/tmp/out.svg', bbox_inches='tight', pad_inches=0, edgecolor='none', facecolor=plt.gcf().get_facecolor()) | |
| else: | |
| plt.xlim(-full_scale*scale, full_scale*scale) | |
| plt.ylim(-full_scale*scale, full_scale*scale) | |
| plt.title(f'{fdx*blocksize/samp_rate:.2f} thru {(fdx+1)*blocksize/samp_rate:.2f} ({fdx*blocksize} thru {(fdx+1)*blocksize})') | |
| plt.show() | |
| # investigate linewidth distribution | |
| # plt.figure() | |
| # plt.plot(widths) | |
| # plt.show() |
Sign up for free
to join this conversation on GitHub.
Already have an account?
Sign in to comment
This code was used to generate the official SigMF logo.