I have a 3d scatter plot, looks like below:
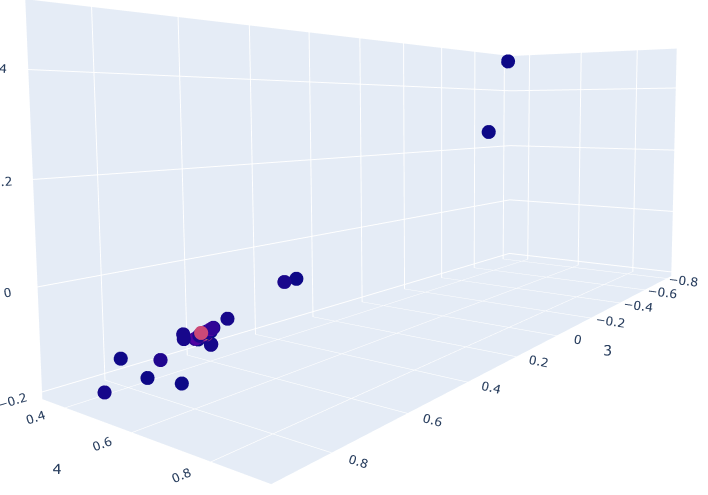
color represent density, so we can see that we basically have one large group, and all the dots jittered around are probably outliers.
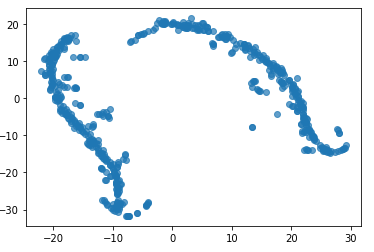
The TSNE plot looks like:
I have a 3d scatter plot, looks like below:
color represent density, so we can see that we basically have one large group, and all the dots jittered around are probably outliers.
The TSNE plot looks like:
| ,Base Curb Weight,Drivetrain,Engine Type,Front Tire Size,Front Wheel Size,Fuel Economy Est-Combined,"Fuel Tank Capacity, Approx","Height, Overall","Length, Overall",Min Ground Clearance,Passenger Capacity,SAE Net Torque @ RPM,Steering Type,Suspension Type - Front,Suspension Type - Rear,Trans Description Cont. | |
| nissan-armada-2021,5577 lbs,Rear Wheel Drive,Regular Unleaded V-8,P265/70HR18,18 X 8 in,16 MPG,26 gal,75.8 in,208.9 in,9.1 in,8,413 @ 4000,Rack-Pinion,Double Wishbone,Double Wishbone,Automatic w/OD | |
| nissan-armada-2022,5577 lbs,Rear Wheel Drive,Regular Unleaded V-8,P265/70HR18,18 X 8 in,16 MPG,26 gal,75.8 in,208.9 in,9.1 in,8,413 @ 4000,Rack-Pinion,Double Wishbone,Double Wishbone,Automatic w/OD | |
| chevrolet-traverse-2022,4310 lbs,Front Wheel Drive,Gas V6,P255/65R18,18 x -TBD- in,21 MPG,19.4 gal,70.7 in,205.9 in,7.51 in,8,266 @ 2800,Electric variable-effort Power Rack & Pinion,MacPherson strut independent,Five-link independent,Automatic | |
| toyota-sequoia-2021,5730 lbs,Rear Wheel Drive,Regular Unleaded V-8,P275/65 |
| from bs4 import BeautifulSoup | |
| import requests | |
| import pandas as pd | |
| def get_info(make,model,year): | |
| url=f'https://www.cars.com/research/{make}-{model}-{year}/specs/' | |
| print (url) | |
| r = requests.get(url) | |
| soup = BeautifulSoup(r.content, 'html5lib') | |
| table = soup.find_all("table") | |
| df_list = [] |
| import regex | |
| # exec(open("test.py").read()) | |
| def get_aligned_sequence2(q,chosen_alignment): | |
| m = chosen_alignment.group() | |
| substitutions, insertions, deletions = chosen_alignment.fuzzy_changes | |
| start = chosen_alignment.span()[0] | |
| indels = {} | |
| # deletion index is for q |