Every ten years, after the decennial census and as mandated by the U.S. Constitution, states are subdivided into sets of congressional districts for representation in the U.S. House of Representatives. GovTrack provides maps of these congressional boundaries for your reference and makes the maps available for embedding on other sites. Beyond looking up the district for a specific address, maps introduce a geographic context that tells us about the demographics and rural/urban nature of a district, as well as whether that district's boundaries show signs of gerrymandering.
Recently, we redesigned GovTrack's map of congressional districts to be more responsive, more legible, and easier to reproduce. To create these maps, we used data from the U.S. Census Bureau, a few cartographic tricks and tools, and web map hosting from Mapbox. I'll explain the process here, and you can reference the exact workflow on GitHub.

GovTrack congressional district maps in the wild: [from left] GovTrack.us, a campaign website, an independent reference website, and an elected official website
The U.S. Census Bureau maintains exact boundary lines of congressional districts, provided as geospatial data files on their FTP site. Census also offers simplified versions of this data for use at different map scales (like if you were looking at the whole country all at once and not at individual neighborhoods or cities). We're careful to avoid using this simplified boundary data because it's not precise at the street-level detail we need.

I use wget to download the boundaries into a directory called data.
$ mkdir data
$ wget -P data ftp://ftp2.census.gov/geo/tiger/TIGER2015/CD/tl_2015_us_cd114.zip
Unzipping this file gives us a directory with what's called a shapefile inside. A shapefile is a geographic data format that is actually a bundle of files with information about geometries and associated attributes for geographic features. Shapefiles are a legacy of desktop GIS platforms and don't play well with web maps or many web mapping tools, so we'll use GDAL ogr2ogr to convert our data to the GeoJSON format.
$ unzip data/tl_2015_us_cd114.zip -d ./data/
$ ogr2ogr -f GeoJSON -t_srs crs:84 data/congressional_districts.geojson data/tl_2015_us_cd114.shp
The next thing we do is run a processing script that modifies our data for better cartographic output. Basically, the script restructures the data for a few map design considerations including:
- Creating label points located in the center of districts with both short and long descriptions for use at different map zoom levels
- Writing a list of geographic bounding boxes so we know how to frame the map when focusing on a specific district or state
- Assigning fill color so that districts bordering each other are never the same color
Figuring out how to assign colors to the districts was tricky. Cartography has a long history of using color to distinguish between regions on political maps, although maybe you haven't seen much of this technique in the relatively short history of web maps. Take this map of the U.S., made in 1855, as an example. It distinguishes between all the existing U.S. states using only four colors with no bordering states having the same color.

Source: The New York Public Library Digital Collections
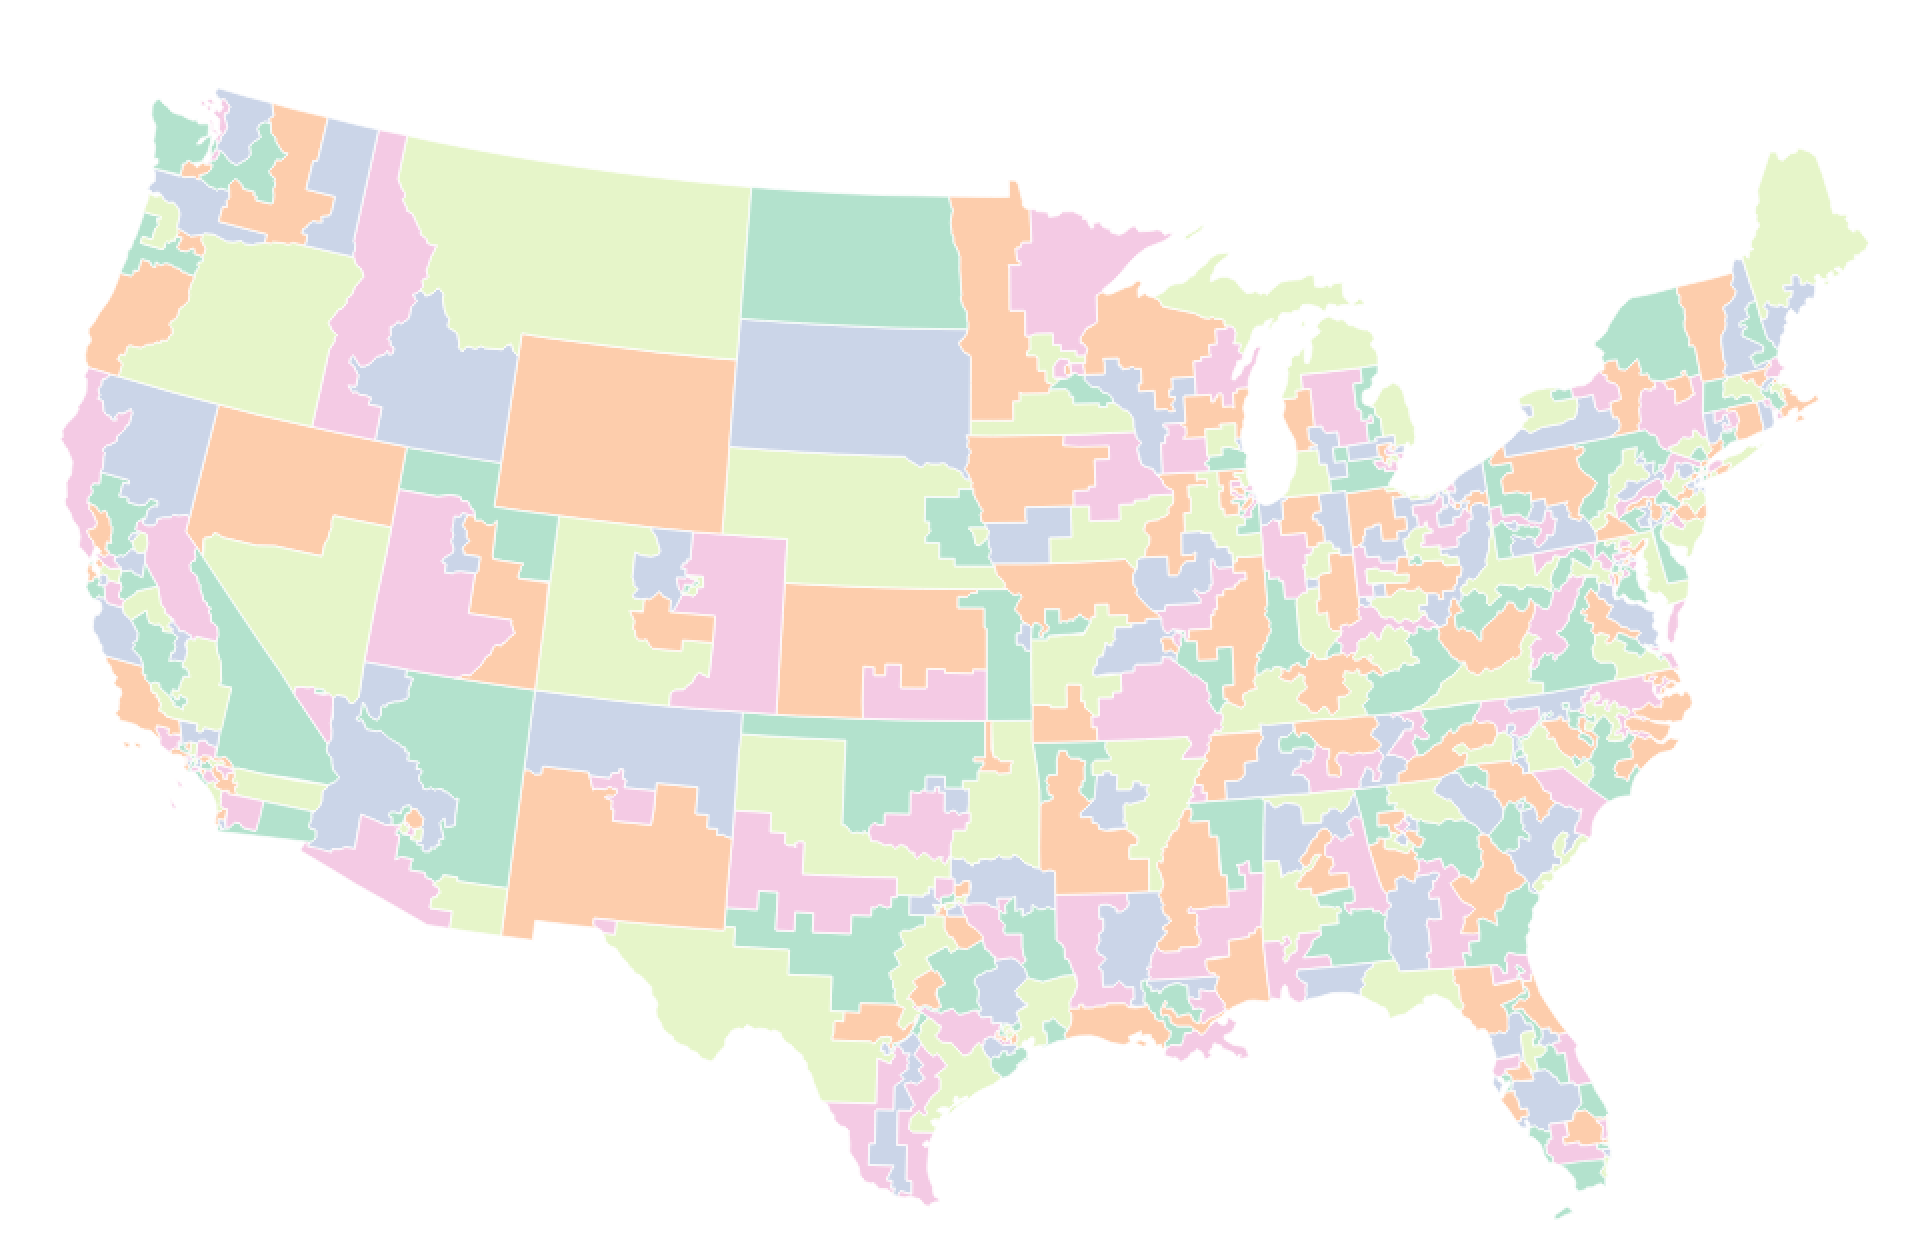
As part of this project, I created a tool for assigning colors to features in a GeoJSON feature collection with one of five colors so that no bordering features are the same color. While it’s possible to do the same with four colors, there's a five color theorem that was much simpler to implement. Here's our 114th Congress's districts in five colors:
With everything prepared, it's time to bring our data to the web. GovTrack now uses Mapbox and the Mapbox GL JS rendering library to keep our custom maps fast and responsive. Mapbox provides a default upload API that would consume our GeoJSON congressional districts data and tile it into a web map, but instead we'll use a tool called Tippecanoe to first tile our data into an mbtiles file and then upload.
Why use Tippecanoe? Using Tippecanoe provides more control over how the geometries are tiled into a map. For comparison, using the Mapbox Studio default upload will not show a zoomed-out full country view of the congressional districts because the boundaries are so detailed; the default upload thinks you are only interested in looking closer at the data. Tippecanoe stops oversimplification of the geometry and also specifies a minimum and maximum zoom level so we can see congressional districts on the map whether we're zoomed in on one city or the entire world.
$ tippecanoe -o data/cd-114-2015.mbtiles \
    -f -z 12 -Z 0 -B 0 -pS -pp -l districts \
    -n "US Congressional Districts" \
    data/map.geojson
Finally, we'll use an upload script to send our map tiles, and a pre-designed style document that references our uploading data and defines how the data is rendered, to Mapbox for hosting.
$ node upload.js data/cd-114-2015.mbtiles
With everything uploaded on Mapbox, I built an embeddable website with Mapbox GL JS for displaying our congressional districts. Mapbox GL JS allows changing the appearance of a map in the web browser, making it possible to filter which congressional districts are displayed based on state or district number.

The source code for this web map is available on GitHub for your use and modification. Refer to this repository for the exact workflow described in this post.