Last active
August 22, 2021 23:20
-
-
Save akrherz/eb5ee79f10535713e3d8724e59db10f0 to your computer and use it in GitHub Desktop.
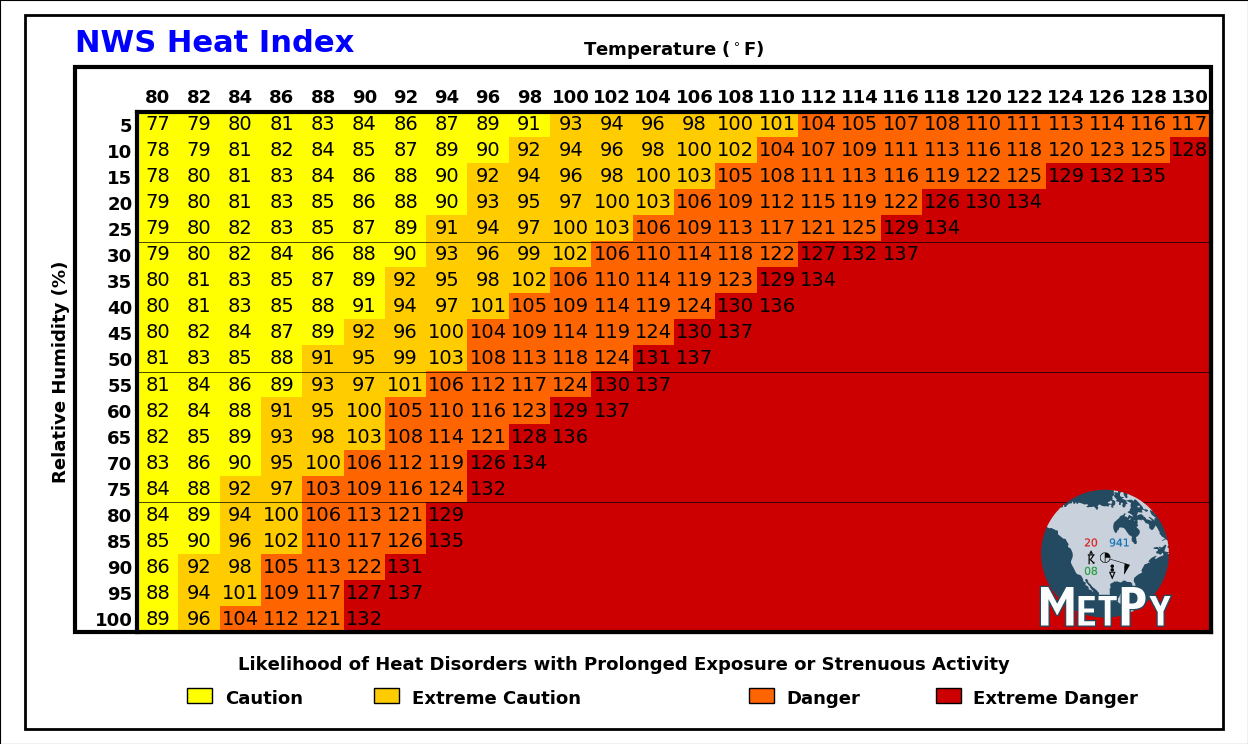
Generates NWS Heat Index Reference Chart
This file contains bidirectional Unicode text that may be interpreted or compiled differently than what appears below. To review, open the file in an editor that reveals hidden Unicode characters.
Learn more about bidirectional Unicode characters
| """Create a pretty table.""" | |
| import numpy as np | |
| from pyiem.plot.use_agg import plt | |
| import matplotlib.colors as mpcolors | |
| from matplotlib.font_manager import FontProperties | |
| from matplotlib import patches | |
| from metpy.calc.basic import heat_index | |
| from metpy.units import units | |
| from metpy.plots import add_metpy_logo | |
| COLORS = ['#ffff02', '#ffcc00', '#fe6500', '#cc0001'] | |
| LEVELS = [0, 91, 103, 126, 200] | |
| LABELS = ['Caution', 'Extreme Caution', 'Danger', 'Extreme Danger'] | |
| # Hard coded non-dimensional x-coordinate on the plot | |
| LEGENDLOCS = [0.15, 0.3, 0.6, 0.75] | |
| def main(): | |
| """Go Main Go.""" | |
| titlefont = FontProperties() | |
| titlefont.set_weight('bold') | |
| titlefont.set_size(22) | |
| lblfont = titlefont.copy() | |
| lblfont.set_size(13) | |
| rh1d = np.arange(5, 101, 5) | |
| tmpf1d = np.arange(80, 131, 2) | |
| tmpf, rh = np.meshgrid(tmpf1d, rh1d) | |
| hi = heat_index(tmpf * units.degF, rh * units.percent) | |
| hi[hi > 137.5 * units.degF] = np.nan | |
| fig = plt.Figure(figsize=(12.48, 7.44)) | |
| faux = fig.add_axes([0, 0, 1, 1]) | |
| faux.xaxis.set_visible(False) | |
| faux.yaxis.set_visible(False) | |
| ax = fig.add_axes([0.11, 0.15, 0.86, 0.7]) | |
| plt.setp(ax.spines.values(), linewidth=3) | |
| # Large outline around the entire plot | |
| rect = patches.Rectangle( | |
| (0.02, 0.02), 0.96, 0.96, linewidth=2, edgecolor='k', | |
| facecolor='none') | |
| faux.add_patch(rect) | |
| # line around chart and labels | |
| rect = patches.Rectangle( | |
| (0.06, 0.15), 0.91, 0.76, linewidth=3, edgecolor='k', facecolor='none') | |
| faux.add_patch(rect) | |
| for color, label, loc in zip(COLORS, LABELS, LEGENDLOCS): | |
| rect = patches.Rectangle( | |
| (loc, 0.055), 0.02, 0.02, linewidth=1, edgecolor='k', | |
| facecolor=color) | |
| faux.add_patch(rect) | |
| fig.text( | |
| loc + 0.03, 0.06, label, va='center', ha='left', | |
| fontproperties=lblfont) | |
| fig.text( | |
| 0.06, 0.93, "NWS Heat Index", color='blue', ha='left', | |
| fontproperties=titlefont) | |
| fig.text( | |
| 0.5, 0.1, | |
| ("Likelihood of Heat Disorders with Prolonged Exposure or " | |
| "Strenuous Activity"), ha='center', fontproperties=lblfont | |
| ) | |
| cmap = mpcolors.ListedColormap(COLORS, "") | |
| cmap.set_bad(COLORS[-1]) | |
| norm = mpcolors.BoundaryNorm(LEVELS, cmap.N) | |
| ax.imshow( | |
| hi, cmap=cmap, norm=norm, | |
| interpolation='nearest', origin='upper', aspect='auto', | |
| extent=[tmpf1d.min() - 1, tmpf1d.max() + 1, | |
| rh1d.max() + 2.5, rh1d.min() - 2.5]) | |
| for col, _ in enumerate(tmpf1d): | |
| for row, _ in enumerate(rh1d): | |
| if np.isnan(hi[row, col].m): | |
| continue | |
| ax.text( | |
| tmpf1d[col], rh1d[row], "%.0f" % (hi[row, col].m, ), | |
| ha='center', va='center', fontsize=14) | |
| # add some guide lines | |
| for y in range(25, 100, 25): | |
| ax.axhline(y + 2.5, lw=0.5, color='k') | |
| ax.set_xticks(tmpf1d) | |
| ax.set_yticks(rh1d[::-1]) | |
| ax.set_yticklabels([str(x) for x in rh1d[::-1]]) | |
| ax.set_xticklabels([str(x) for x in tmpf1d]) | |
| ax.set_ylim(rh1d.max() + 2.5, rh1d.min() - 2.5) | |
| ax.set_xlim(tmpf1d.min() - 1, tmpf1d.max() + 1) | |
| ax.xaxis.tick_top() | |
| ax.xaxis.set_label_position('top') | |
| ax.tick_params(axis='both', which='both', length=0) | |
| ax.set_ylabel( | |
| "Relative Humidity (%)", fontproperties=lblfont, labelpad=15 * 1.2) | |
| ax.set_xlabel( | |
| r"Temperature ($^\circ$F)", fontproperties=lblfont, labelpad=20 * 1.2) | |
| plt.setp( | |
| ax.yaxis.get_majorticklabels(), rotation=0, fontproperties=lblfont) | |
| plt.setp( | |
| ax.xaxis.get_majorticklabels(), rotation=0, fontproperties=lblfont) | |
| add_metpy_logo(fig, 1030, 110, size='large') | |
| fig.savefig('test.png') # , orientation='landscape') | |
| if __name__ == '__main__': | |
| main() |
Plot updated to include more RH range and remove seaborn requirement.
Sign up for free
to join this conversation on GitHub.
Already have an account?
Sign in to comment
Resulting plot
Requires currently un-released MetPy 0.11