Last active
February 6, 2018 04:22
-
-
Save akshaykarnawat/1550769b12c1b1f5dcc1c953eb109380 to your computer and use it in GitHub Desktop.
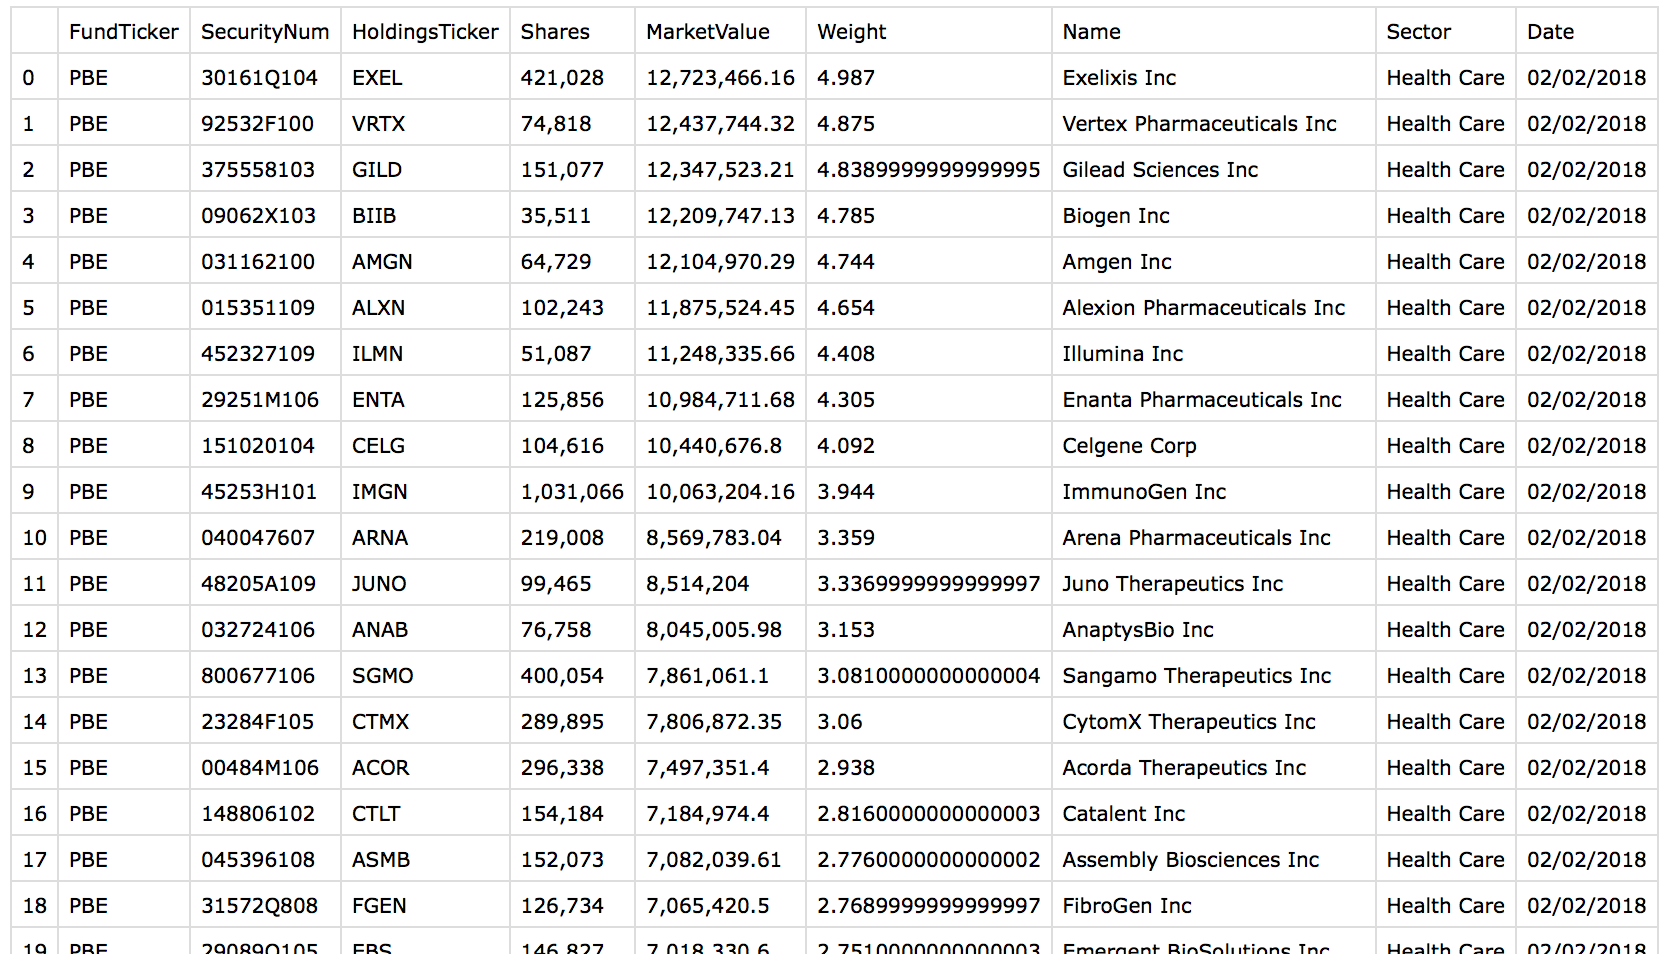
Get holding details for invesco ETFs and see %change histogram of historical data within the invesco fund
This file contains bidirectional Unicode text that may be interpreted or compiled differently than what appears below. To review, open the file in an editor that reveals hidden Unicode characters.
Learn more about bidirectional Unicode characters
| import io | |
| import json | |
| import math | |
| import requests | |
| import pandas as pd | |
| import datetime as dt | |
| from os import makedirs | |
| from os.path import isdir | |
| from bs4 import BeautifulSoup | |
| from itertools import compress | |
| import matplotlib.pyplot as plt | |
| from multiprocessing.pool import Pool | |
| site_url = 'https://www.invesco.com' | |
| product_detail_url = 'https://www.invesco.com/portal/site/us/financial-professional/etfs/product-detail' | |
| #free 50 call for unregistered user per day | |
| #register or find a better api | |
| quandl_link = 'https://www.quandl.com/api/v3/datasets/WIKI/' | |
| #code cleanup and optimization required | |
| # ticker = 'XSLV' #PowerShares S&P SmallCap Low Volatility Portfolio | |
| ticker = 'PBE' #PowerShares Dynamic Biotechnology & Genome Portfolio | |
| request = requests.get('%s?productId=%s' %(product_detail_url, ticker)) | |
| products_details = request.text | |
| soup = BeautifulSoup(products_details, 'html.parser') | |
| a_tags_list = soup.find_all('a', {'class': 'small'}) | |
| fundHoldingList = list(compress(a_tags_list, [True if 'Fund Holdings' in str(a) else False for a in a_tags_list])) | |
| fundHoldingsLink = fundHoldingList[0]['href'] | |
| request = requests.get(site_url + fundHoldingsLink) | |
| fund_holdings_page_text = request.text | |
| soup = BeautifulSoup(fund_holdings_page_text, 'html.parser') | |
| scripts = soup.find_all('script') | |
| downloadUrl_script = list(compress(scripts, ["$('#downloadUrlLink')" in script.text for script in soup.find_all('script')])) | |
| ff = downloadUrl_script[0].text.split(';') | |
| partial_downloadUrlLink = list(compress(ff, ['downloadUrlLink' in f for f in ff]))[0].split(',')[1].split('+')[0].replace('\'', '') | |
| params_lst = list(compress(ff, ['params' in f for f in ff]))[0].replace('\n', '').replace('\t', '').split(',')[1].replace('\'', '')[:-1].replace(':ticker', '=%s' %(ticker)) | |
| date = dt.datetime.today().strftime("%a+%b+%d+%Y+%H%%3A%M%%3A%S+GMT-0500+(EST)") | |
| downloadUrlLink = ''.join([partial_downloadUrlLink, 'ts=', date, '&', params_lst]) | |
| request = requests.get(site_url + downloadUrlLink).content | |
| csv_contents = pd.read_csv(io.StringIO(request.decode('utf-8'))) | |
| if not isdir('./holdings/' + ticker + '/fund_holdings/'): | |
| makedirs('./holdings/' + ticker + '/fund_holdings/') | |
| csv_contents.to_csv('./holdings/'+ ticker + '/fund_holdings/fund_holdings.csv') | |
| # funds_length = len(csv_contents['HoldingsTicker'].values) | |
| def csv_data_for_fund_holdings(symbol): | |
| print("processing symbol :: ", symbol) | |
| # stock_historical_data_frame = requests.get(url=quandl_link + symbol + '.csv').content | |
| stock_historical_data_frame = requests.get(url=quandl_link + symbol + '.csv?start_date=2017-11-01&end_date=2018-01-31').content | |
| if not isdir('./holdings/' + ticker + '/fund_holdings_tickers_historical/' + symbol): | |
| makedirs('./holdings/' + ticker + '/fund_holdings_tickers_historical/' + symbol) | |
| pd.read_csv(io.StringIO(stock_historical_data_frame.decode('utf-8'))).to_csv('./holdings/' + ticker + '/fund_holdings_tickers_historical/' + symbol + '/' + symbol + '.csv') | |
| print(symbol, " :: DONE!") | |
| # [csv_data_for_fund_holdings(symbol) for symbol in csv_contents['HoldingsTicker'].str.strip().values] | |
| p = Pool() | |
| p.map(csv_data_for_fund_holdings, csv_contents['HoldingsTicker'].str.strip().values) | |
| for symbol in csv_contents['HoldingsTicker'].str.strip().values: | |
| df = pd.read_csv('./holdings/' + ticker + '/fund_holdings_tickers_historical/' + symbol + '/' + symbol + '.csv') | |
| if df is not None and not df.empty and 'Adj. Close' in df: | |
| # df.set_index('Date', inplace=True) | |
| df['Percent Change'] = df['Adj. Close'][::-1].pct_change()[::-1]*100 | |
| df.to_csv('./holdings/' + ticker + '/fund_holdings_tickers_historical/' + symbol + '/' + symbol + '.csv') | |
| histogram = {} | |
| for i in range(math.ceil(df['Percent Change'].min()), math.ceil(df['Percent Change'].max())): | |
| for value in df['Percent Change'].values: | |
| if value > i and value <= i+1: | |
| histogram.setdefault(i, []).append(value) | |
| with open('./holdings/' + ticker + '/fund_holdings_tickers_historical/' + symbol + '/' + symbol + '_histogram.json', 'w') as f: | |
| json.dump(histogram, f, indent=2) | |
| plt.figure() | |
| plt.plot(list(histogram.keys()), [len(v) for k, v in histogram.items()]) | |
| plt.savefig('./holdings/' + ticker + '/fund_holdings_tickers_historical/' + symbol + '/' + symbol + '_histogram.png', bbox_inches='tight') | |
| plt.close('all') | |
Sign up for free
to join this conversation on GitHub.
Already have an account?
Sign in to comment
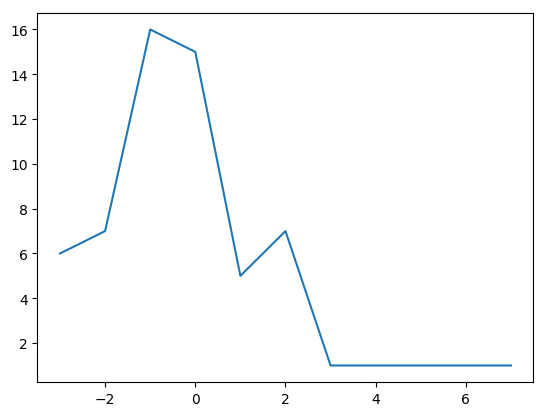
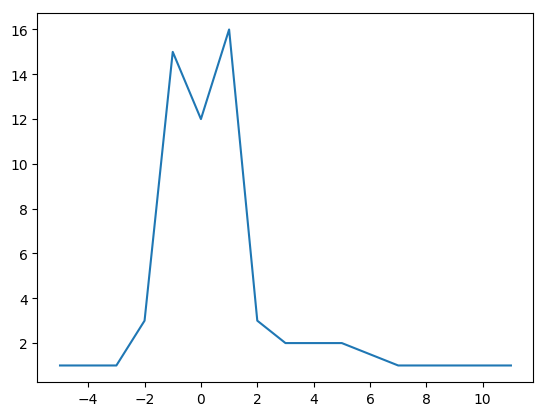
%change histograms for past 60 days
#ARNA
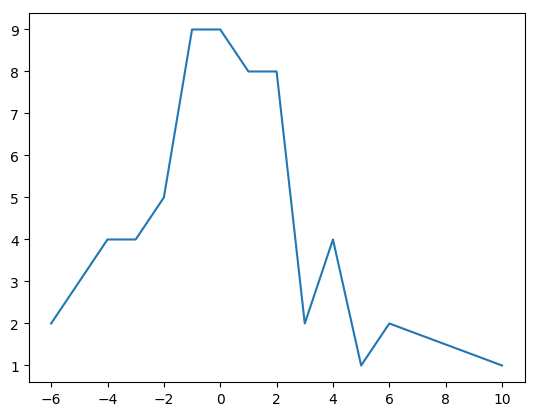
#AlXN
#ENTA
#fund_holdings