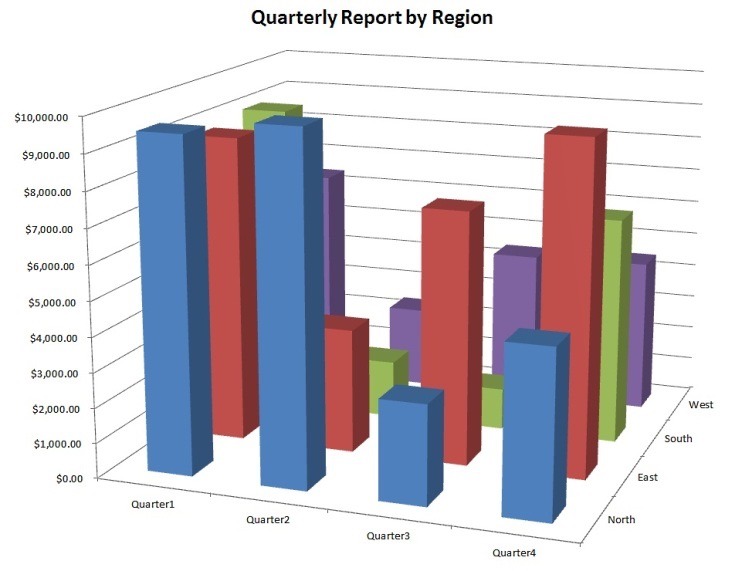
From WTF Vizualizations: ![3D Bar Chart] (http://41.media.tumblr.com/868899a6d00dcb0ee241ba6c3d98e8fc/tumblr_ntadud7h0b1sgh0voo1_1280.jpg)
Last active
September 28, 2015 04:35
-
-
Save amirebrahimi/227604fb1b05d79f6a56 to your computer and use it in GitHub Desktop.
Visualization Makeover
This file contains bidirectional Unicode text that may be interpreted or compiled differently than what appears below. To review, open the file in an editor that reveals hidden Unicode characters.
Learn more about bidirectional Unicode characters
| <!DOCTYPE html> | |
| <html> | |
| <head> | |
| <meta charset="utf-8"> | |
| <script src="http://d3js.org/d3.v3.min.js"></script> | |
| <script src="http://dimplejs.org/dist/dimple.v2.0.0.min.js"></script> | |
| <style> | |
| h2 { | |
| margin-left: 75px; | |
| } | |
| </style> | |
| <script type="text/javascript"> | |
| function draw(data) { | |
| "use strict"; | |
| var margin = 75, | |
| width = 960 - margin, | |
| height = 400 - margin; | |
| var header = d3.select("body") | |
| .append("h2") | |
| .text("Quarterly Report by Region"); | |
| var svg = d3.select("body") | |
| .append("svg") | |
| .attr("width", width + margin) | |
| .attr("height", height + margin) | |
| .append('g') | |
| .attr('class','chart'); | |
| // dimple.js | |
| var myChart = new dimple.chart(svg, data); | |
| myChart.addCategoryAxis("x", "Quarter"); | |
| myChart.addMeasureAxis("y", "Amount"); | |
| var regionSeries = myChart.addSeries("Region", dimple.plot.line); | |
| myChart.addLegend(0, 10, "100%", 100, "right", regionSeries); | |
| myChart.addSeries("Region", dimple.plot.point); | |
| myChart.draw(); | |
| } | |
| </script> | |
| </head> | |
| <body> | |
| <script type="text/javascript"> | |
| d3.csv("quarterly_data.csv", draw); | |
| </script> | |
| </body> | |
| </html> |
This file contains bidirectional Unicode text that may be interpreted or compiled differently than what appears below. To review, open the file in an editor that reveals hidden Unicode characters.
Learn more about bidirectional Unicode characters
| Region | Quarter | Amount | |
|---|---|---|---|
| North | Q1 | 9000 | |
| North | Q2 | 9500 | |
| North | Q3 | 3000 | |
| North | Q4 | 5500 | |
| East | Q1 | 8500 | |
| East | Q2 | 4000 | |
| East | Q3 | 7000 | |
| East | Q4 | 9000 | |
| South | Q1 | 8750 | |
| South | Q2 | 1500 | |
| South | Q3 | 1000 | |
| South | Q4 | 6500 | |
| West | Q1 | 7000 | |
| West | Q2 | 2500 | |
| West | Q3 | 4000 | |
| West | Q4 | 4000 |
Sign up for free
to join this conversation on GitHub.
Already have an account?
Sign in to comment