library(tidyverse)

example_df <- tribble(
  ~Year, ~Category, ~Name,
  2015,  "A",       "1",
  2015,  "A",       "3",
  2015,  "A",       "5",
  2015,  "C",       "2",
  2015,  "C",       "4",
  2016,  "A",       "1",
  2016,  "A",       "4",
  2016,  "B",       "2",
  2016,  "B",       "3",
  2016,  "B",       "5",
  2017,  "B",       "1",
  2017,  "B",       "2",
  2017,  "B",       "3",
  2017,  "B",       "4",
  2017,  "C",       "5",
  2018,  "B",       "1",
  2018,  "B",       "2",
  2018,  "B",       "3",
  2018,  "B",       "4",
  2018,  "B",       "5"
) %>%
mutate(Year = factor(Year))ggplot(example_df, aes(x = Year, y = fct_rev(Category), color = Name)) +
geom_point(size = 3) +
labs(title = "No jittering; overplotting") +
theme(legend.position = "bottom")
ggplot(example_df, aes(x = Year, y = fct_rev(Category), color = Name)) +
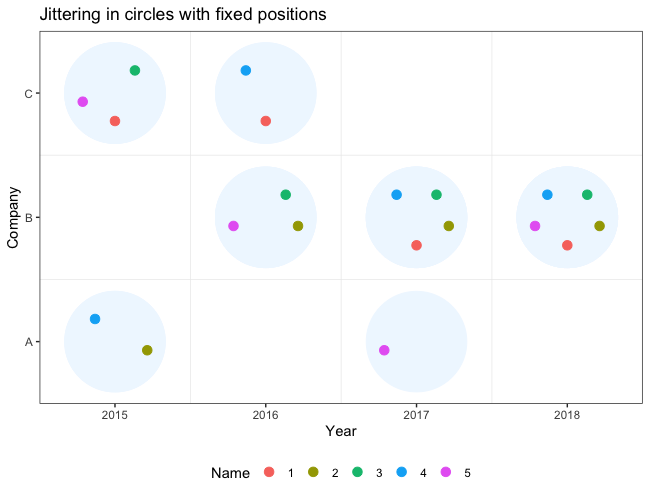
geom_point(size = 3, position = position_jitter()) +
labs(title = "Jittering; positioning not consistent") +
theme(legend.position = "bottom")
Created on 2020-10-25 by the reprex package (v0.3.0)
I would do it this way: