Created
October 11, 2019 02:58
-
-
Save arvi1000/9e13c187662badd4c78445602efcaee4 to your computer and use it in GitHub Desktop.
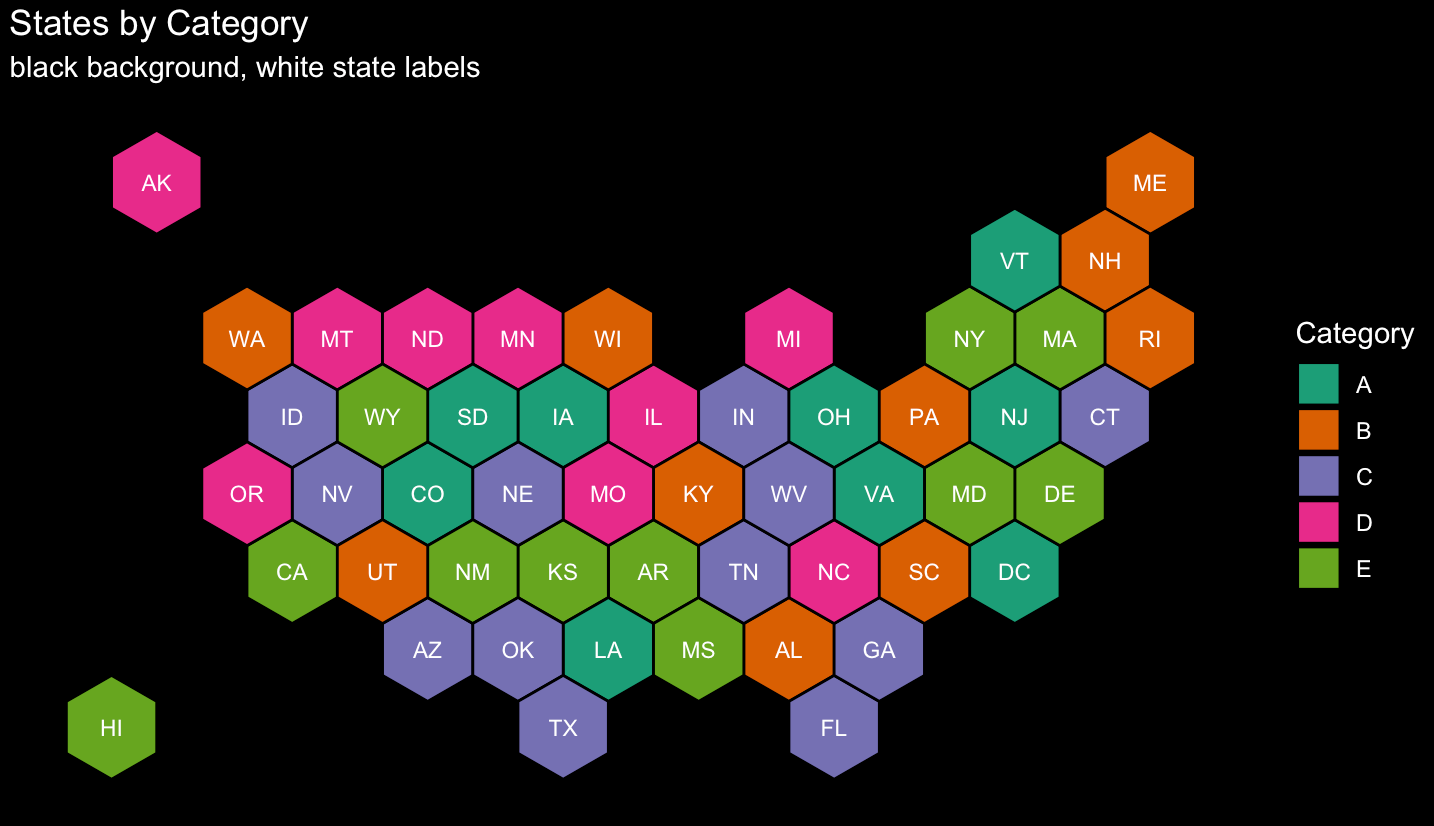
Changing label colors with rGridMap
This file contains bidirectional Unicode text that may be interpreted or compiled differently than what appears below. To review, open the file in an editor that reveals hidden Unicode characters.
Learn more about bidirectional Unicode characters
| devtools::install_github('arvi1000/rGridMap') | |
| library(rGridMap) | |
| library(ggplot2) | |
| # a data.frame of states with random categorical value | |
| set.seed(123) | |
| my_dat <- data.frame(state.abb = c(state.abb, 'DC'), # don't forget DC! | |
| value=sample(LETTERS[1:5], 51, replace=T)) | |
| plotGridMap(my_dat, fill_var = 'value', | |
| # this turns labels white | |
| label_color = 'white') + | |
| scale_fill_brewer(type='qual', palette = 2) + | |
| labs(title = 'States by Category', fill = 'Category', | |
| subtitle = 'black background, white state labels') + | |
| # this is to make background black | |
| theme(rect = element_rect(fill='black'), | |
| text = element_text(color='white'), | |
| legend.key= element_blank()) |
Author
arvi1000
commented
Oct 11, 2019
Sign up for free
to join this conversation on GitHub.
Already have an account?
Sign in to comment