Last active
January 12, 2024 03:06
-
-
Save asehmi/93c9e2934b26fc86b0a9283e4d7d0f5d to your computer and use it in GitHub Desktop.
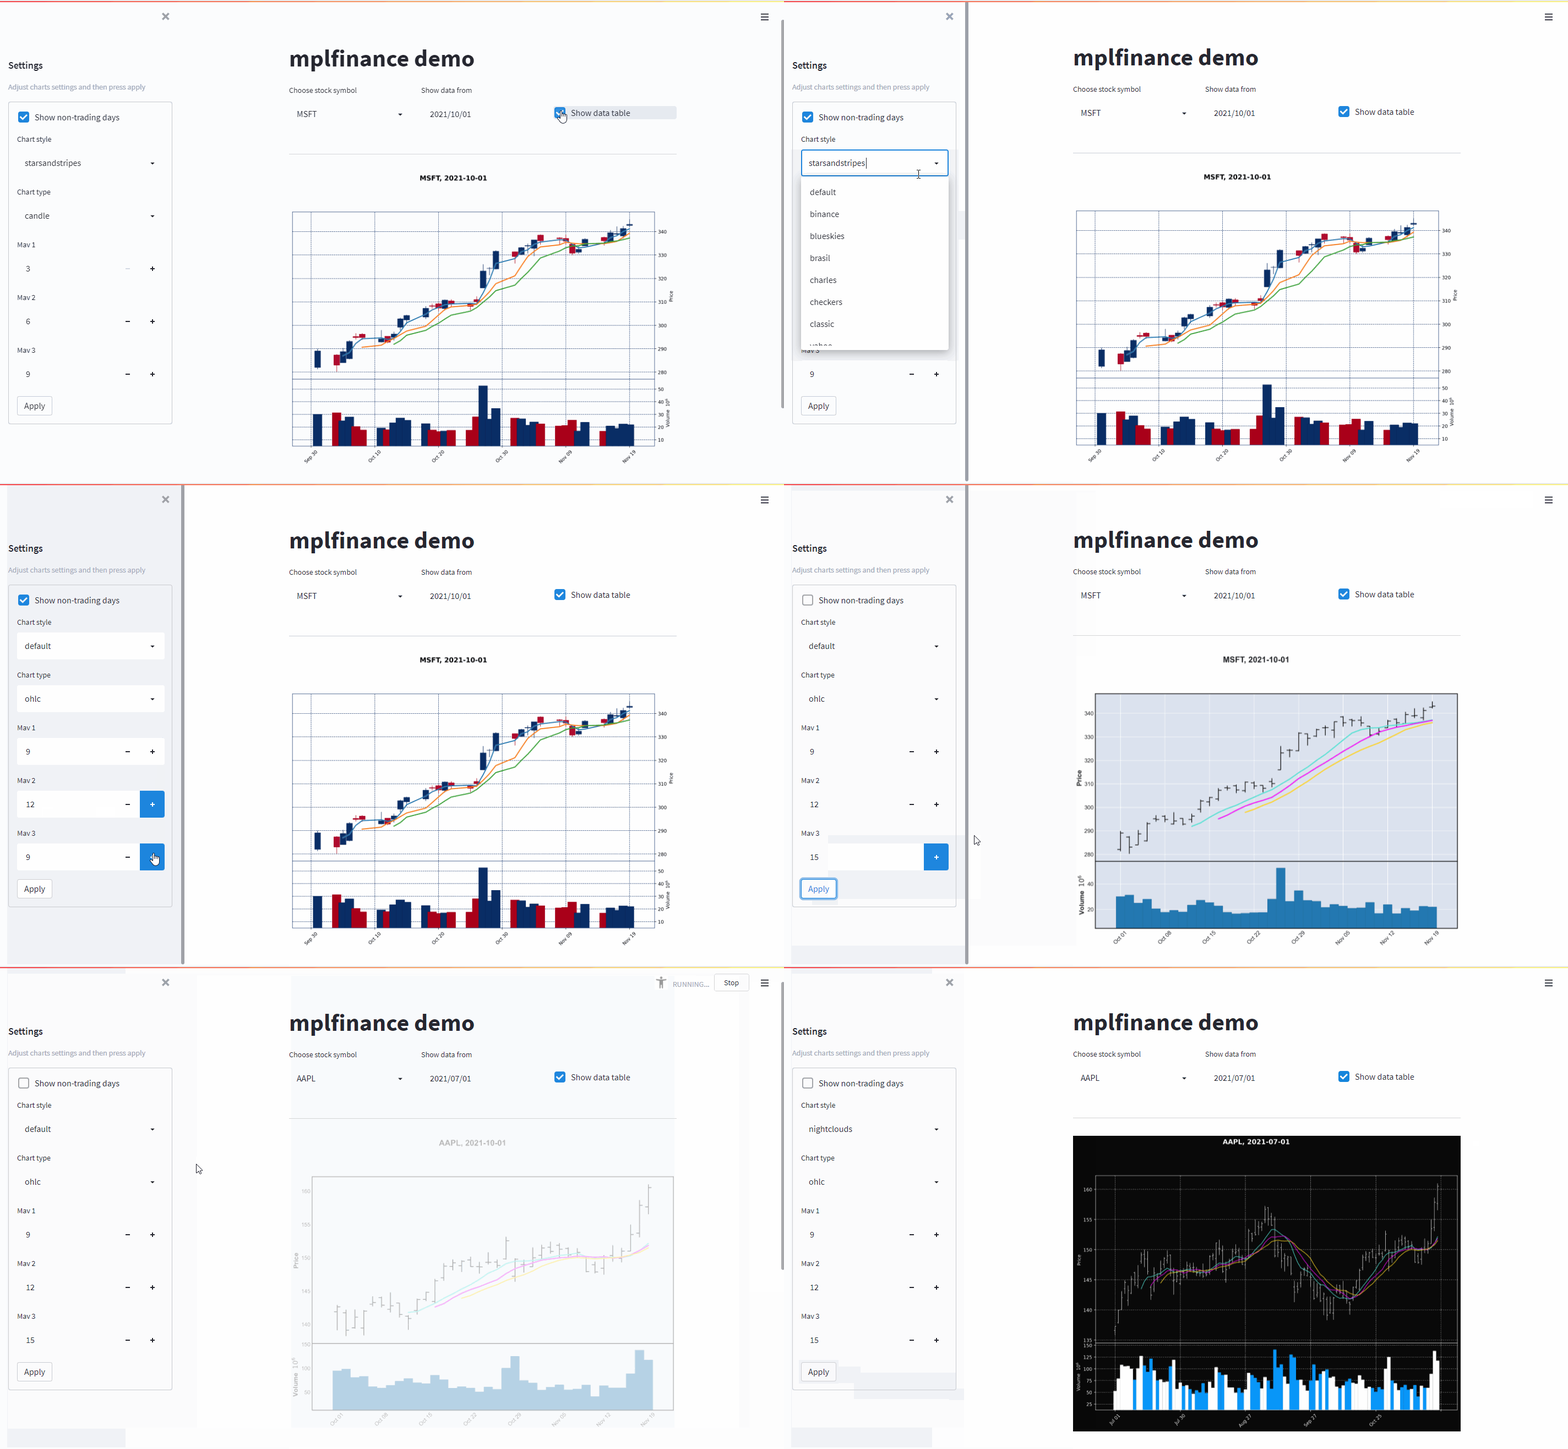
How to use mplfinance in Streamlit
This file contains bidirectional Unicode text that may be interpreted or compiled differently than what appears below. To review, open the file in an editor that reveals hidden Unicode characters.
Learn more about bidirectional Unicode characters
| from datetime import date, datetime | |
| import streamlit as st | |
| import pandas as pd | |
| import mplfinance as mpf | |
| from pandas_datareader import data as pdr | |
| @st.experimental_memo(persist='disk') | |
| def get_historical_data(symbol, start_date = None): | |
| df = pdr.get_data_yahoo(symbol, start=start_date, end=datetime.now()) | |
| for col in df.columns: | |
| df[col] = df[col].astype(float) | |
| df.index = pd.to_datetime(df.index) | |
| if start_date: | |
| df = df[df.index >= start_date] | |
| return df | |
| st.title('mplfinance demo') | |
| c1, c2, c3 = st.columns([1,1,1]) | |
| with c1: | |
| if st.checkbox('Custom symbol', False): | |
| symbol = st.text_input('Custom stock symbol').upper() | |
| else: | |
| symbol = st.selectbox('Choose stock symbol', options=['OKTA', 'AAPL', 'MSFT', 'GOOG', 'AMZN'], index=1) | |
| with c2: | |
| st.write(' ') | |
| date_from = st.date_input('Show data from', date(2021, 10, 1)) | |
| with c3: | |
| st.write(' ') | |
| st.write(' ') | |
| show_data = st.checkbox('Show data table', False) | |
| st.markdown('---') | |
| st.sidebar.subheader('Settings') | |
| st.sidebar.caption('Adjust charts settings and then press apply') | |
| with st.sidebar.form('settings_form'): | |
| show_nontrading_days = st.checkbox('Show non-trading days', True) | |
| # https://github.com/matplotlib/mplfinance/blob/master/examples/styles.ipynb | |
| chart_styles = [ | |
| 'default', 'binance', 'blueskies', 'brasil', | |
| 'charles', 'checkers', 'classic', 'yahoo', | |
| 'mike', 'nightclouds', 'sas', 'starsandstripes' | |
| ] | |
| chart_style = st.selectbox('Chart style', options=chart_styles, index=chart_styles.index('starsandstripes')) | |
| chart_types = [ | |
| 'candle', 'ohlc', 'line', 'renko', 'pnf' | |
| ] | |
| chart_type = st.selectbox('Chart type', options=chart_types, index=chart_types.index('candle')) | |
| mav1 = st.number_input('Mav 1', min_value=3, max_value=30, value=3, step=1) | |
| mav2 = st.number_input('Mav 2', min_value=3, max_value=30, value=6, step=1) | |
| mav3 = st.number_input('Mav 3', min_value=3, max_value=30, value=9, step=1) | |
| st.form_submit_button('Apply') | |
| @st.experimental_memo() | |
| def get_data(symbol, date_from): | |
| data = get_historical_data(symbol, str(date_from)) | |
| return data | |
| def plot_data(symbol, date_from, data): | |
| fig, ax = mpf.plot( | |
| data, | |
| title=f'{symbol}, {date_from}', | |
| type=chart_type, | |
| show_nontrading=show_nontrading_days, | |
| mav=(int(mav1),int(mav2),int(mav3)), | |
| volume=True, | |
| style=chart_style, | |
| figsize=(15,10), | |
| # Need this setting for Streamlit, see source code (line 778) here: | |
| # https://github.com/matplotlib/mplfinance/blob/master/src/mplfinance/plotting.py | |
| returnfig=True | |
| ) | |
| st.pyplot(fig) | |
| if symbol: | |
| data = get_data(symbol, date_from) | |
| plot_data(symbol, date_from, data) | |
| if show_data: | |
| st.markdown('---') | |
| st.subheader(f'Data ({symbol})') | |
| st.dataframe(data) | |
Sign up for free
to join this conversation on GitHub.
Already have an account?
Sign in to comment
Demo
