###Parsons: Journalism + Design ###Web Coding for Interactive Design October 14th, 2015
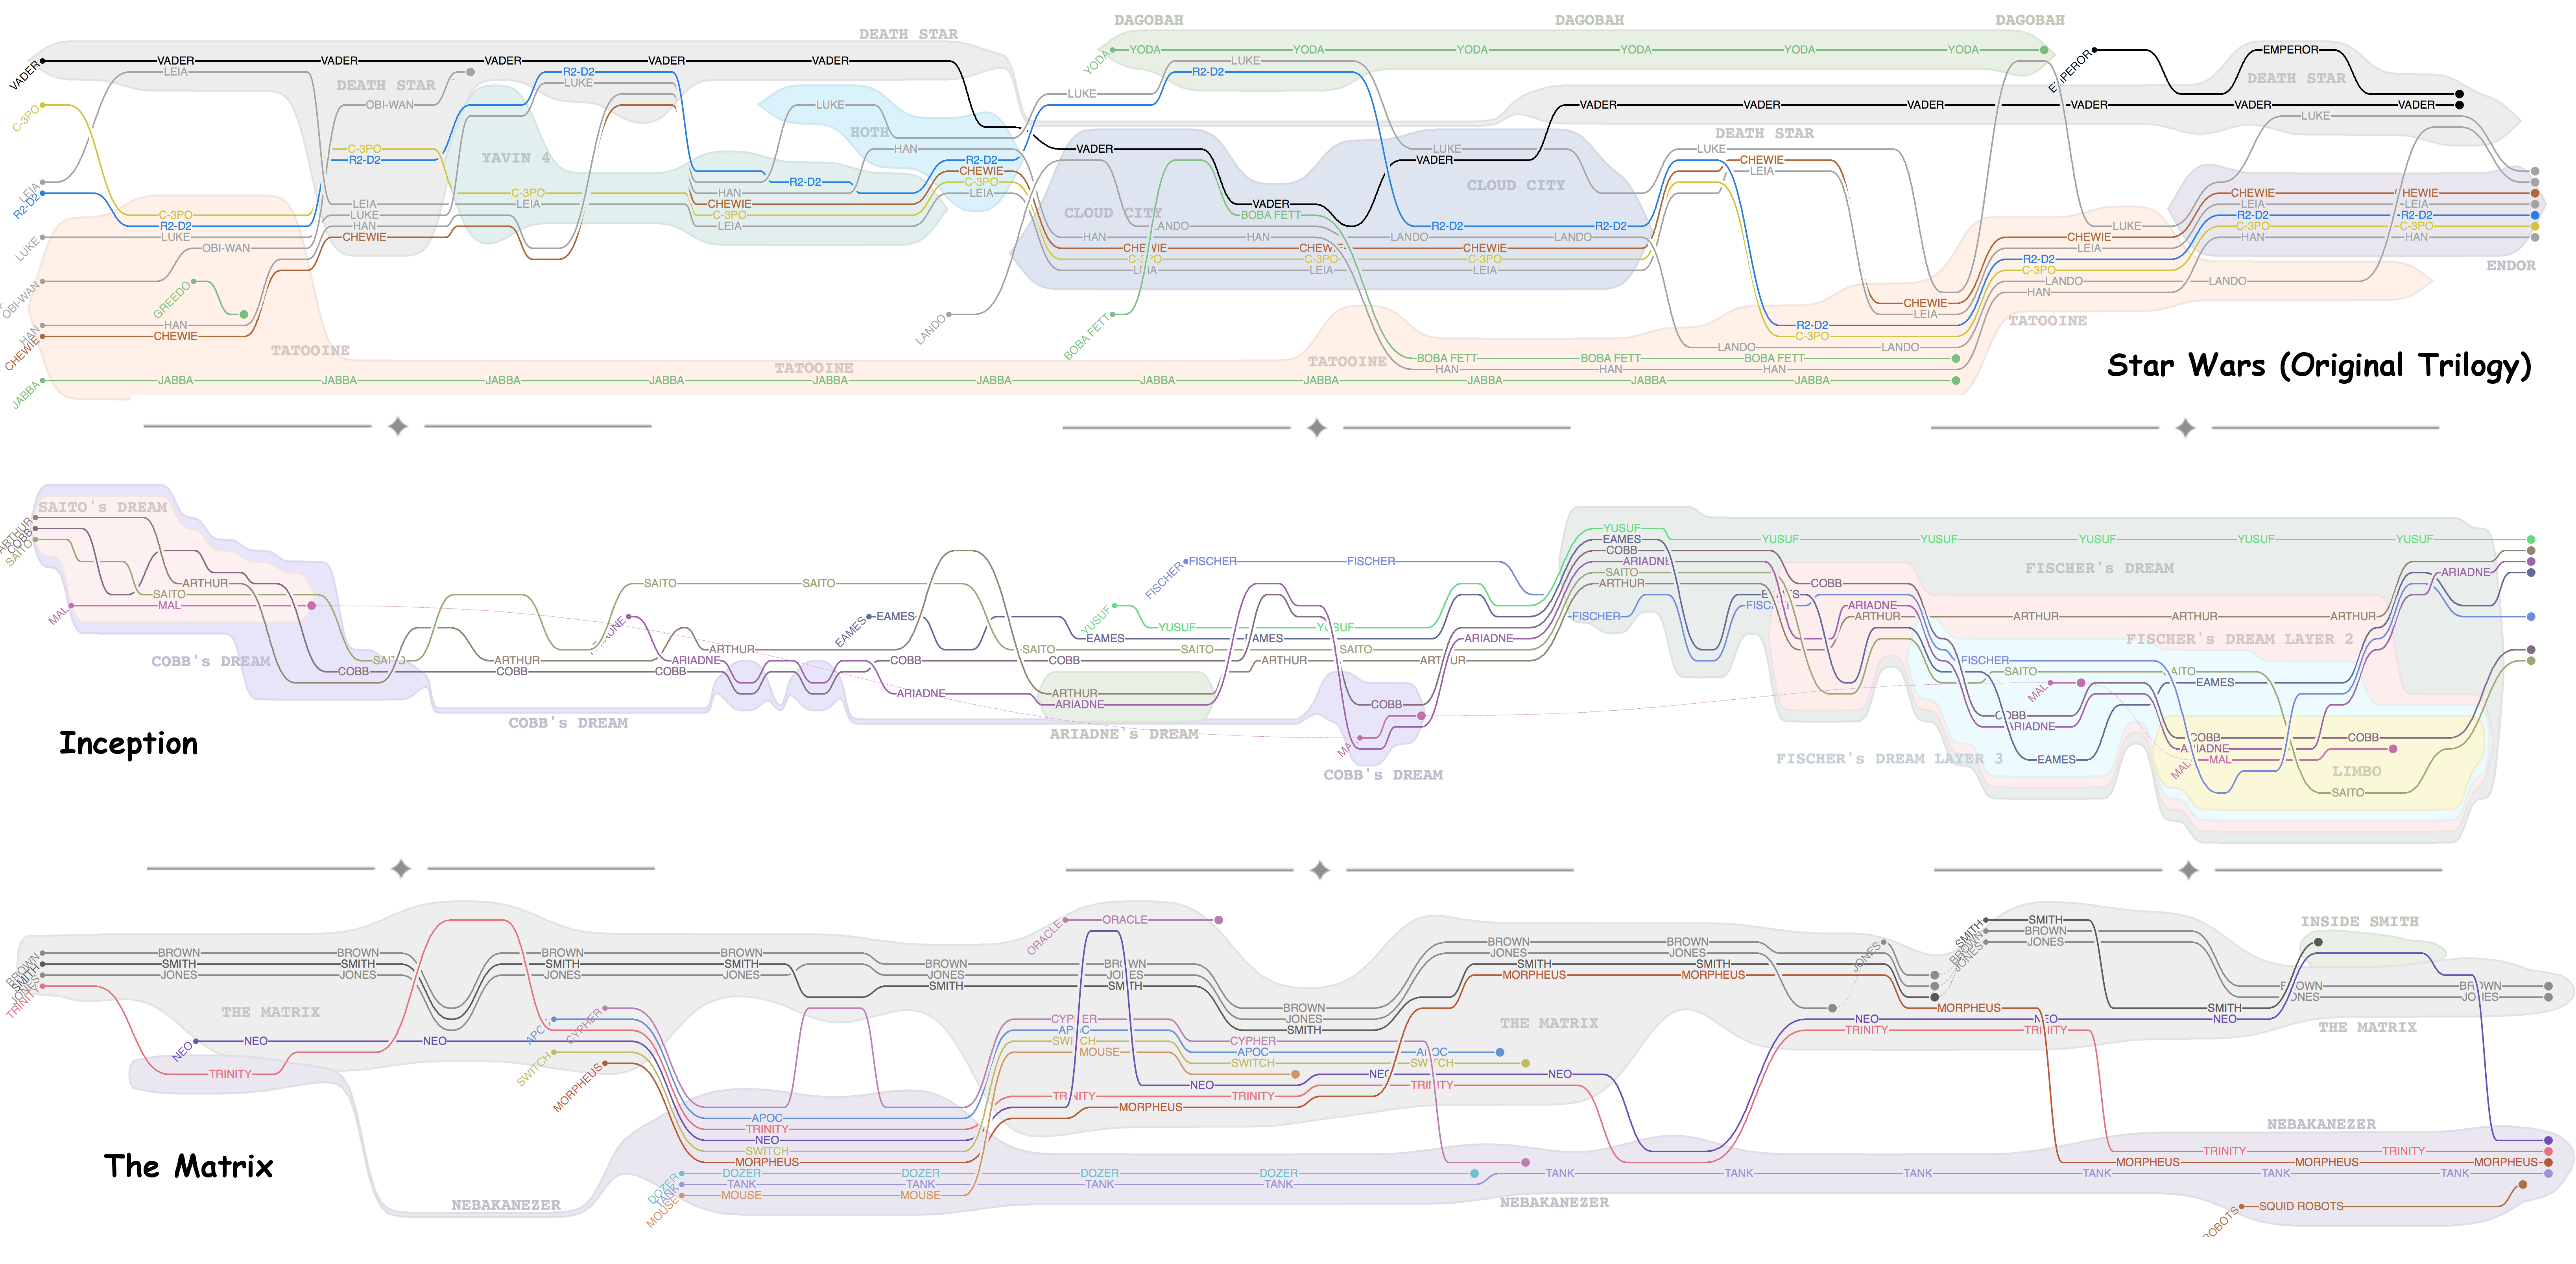
Interactive to inspire: Tanahashi, Y., UC Davis, StoryLines You can read their paper on the topic here.
Find this document here:
- Graph Basics
- Definitions
- Anatomy of a Graph
- Graph Data
- Examples + Formats
- Graph Tools
- Libraries + Frameworks
- Building A Narrative
- Case Study 1: NYC Graphiti Graph
- Case Study 2: OSM Tag Graph
- Bl.ocks for Mapping display
- Resources
Network or Graph Data is data the involves connections between entities where those relationships can be described/explained/made to have value.
It should be noted that this definition of graph is distinct from "charts and graphs" which could involve any type of chart.
Exammple: Facebook Graph:
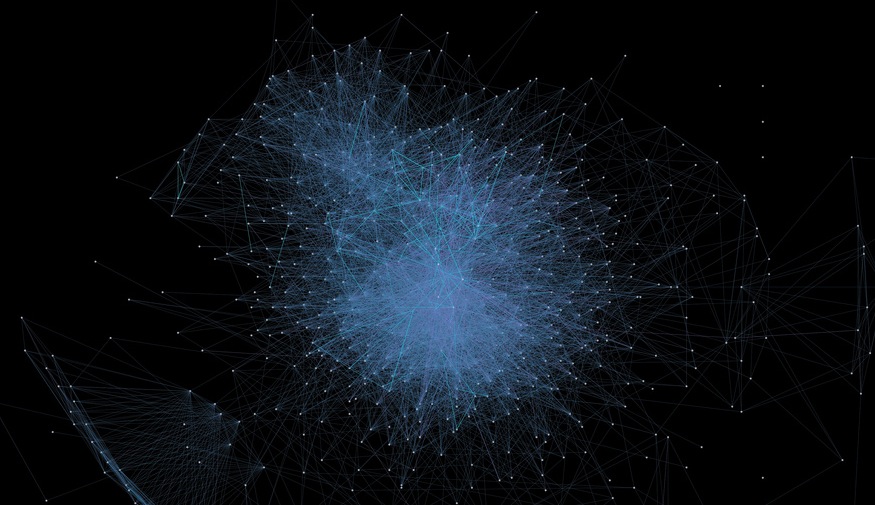
Think about difference Facebook Graph Visualizations:
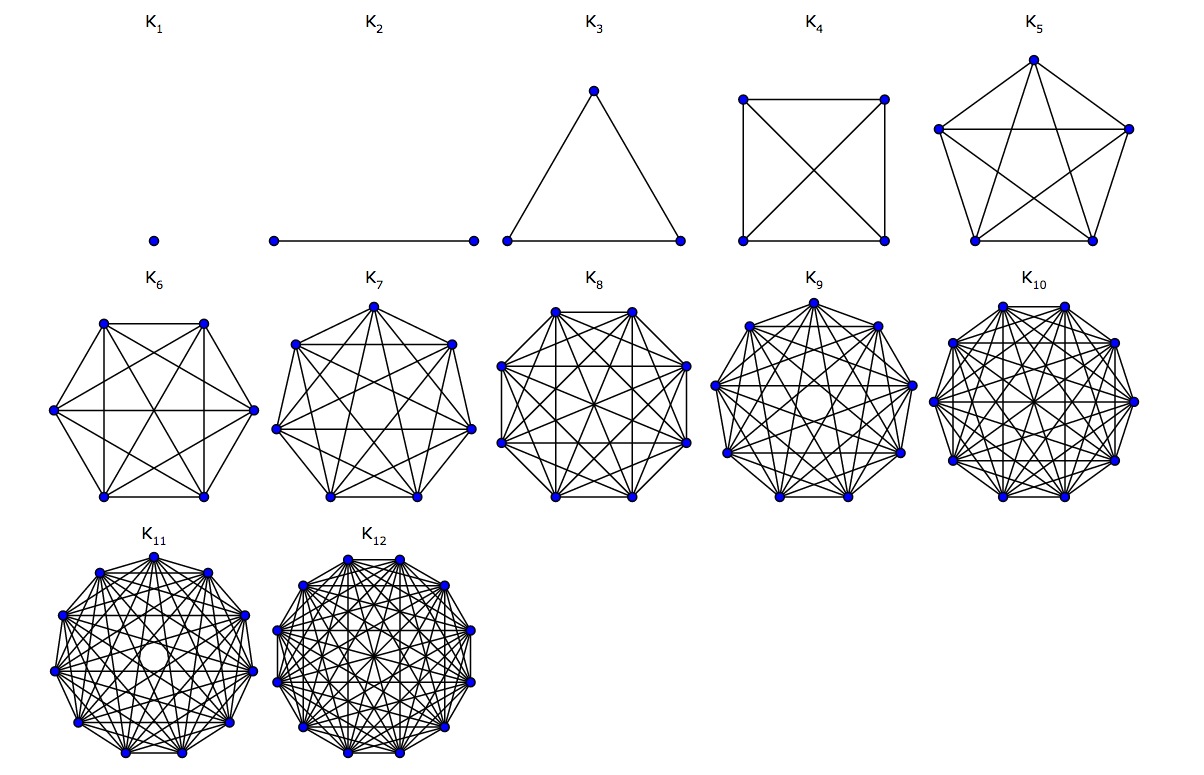
A graph is composed (visibly) of points and lines that connect them, these are sometimes called:
- Nodes: the points/things existing in the network.
- Edges: the lines or relationships that connect the nodes to eachother and create a larger network.
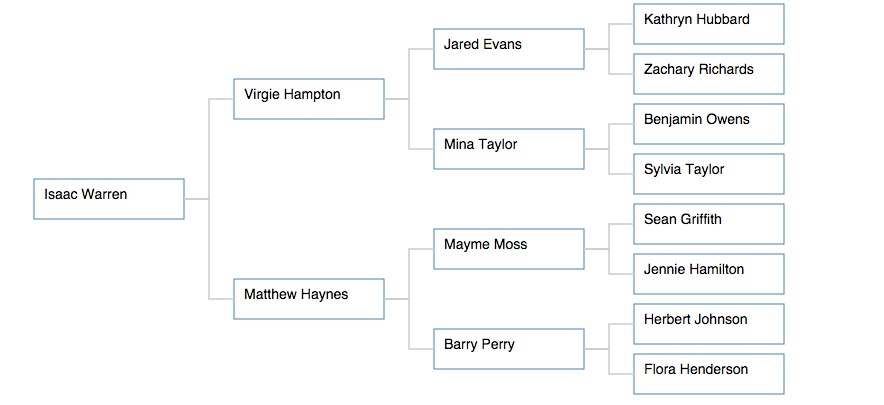
In a graph of your family, for example, the family tree would be a kind of graph visualization, illustrating both the people in the family (nodes) and the connections between them like "daughter of" "son of" (edges).
You might also read:
-
Vectors: like in math, vectors apply directionality to the edges, so parent->child nodes on a family tree have their relational edge describing that the "child" is the daughter and not the other way around.
-
Force-directed: way of drawing graphs such that the nodes and edges spread out agreeably.
Try drawing your own graph here: http://bl.ocks.org/mbostock/929623
You can source graph data in a few places, but you might just want to make your own.
- Facebook Graph Data Download | Graph API | Graph Explorers
- Google Public Data Directory
- Les Miserables Character Connections
- Gexf Sample Datasets
- Middle Eastern Country Relationships
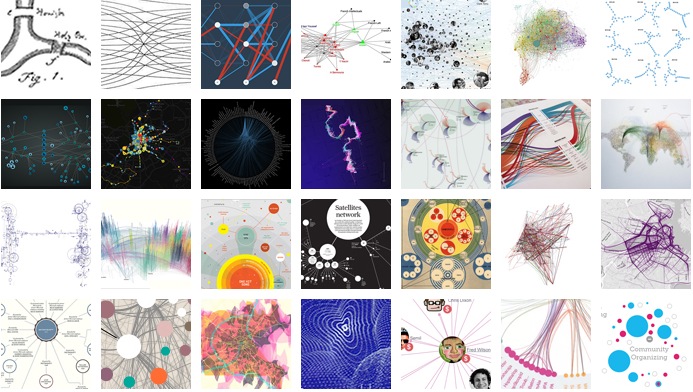
There are all types of graph visualizations. You might check out Manuel Lima's blog Visual Complexity for examples of the kinds of narratives you can build with graphs.
SEMANTIC NETWORKS
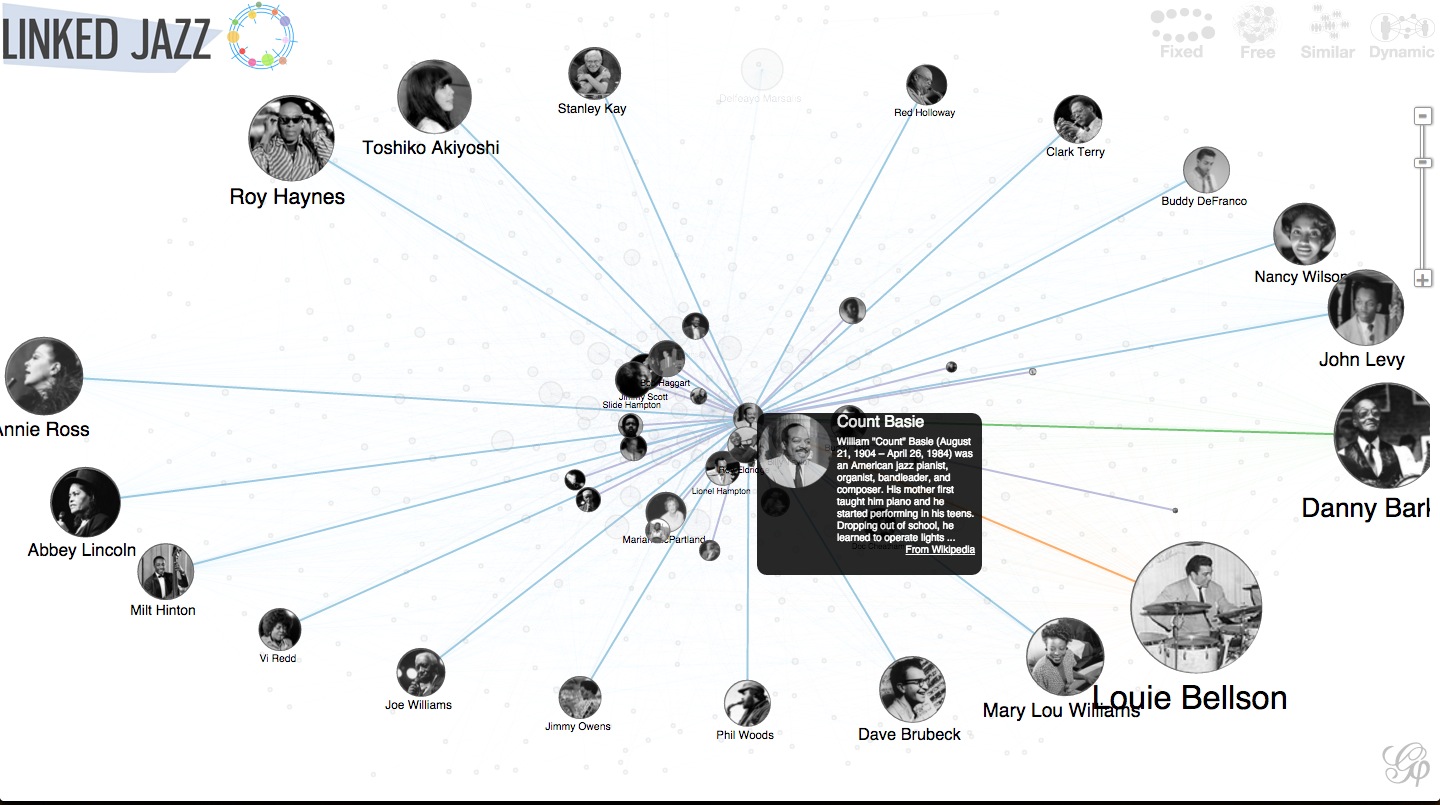
Linked Jazz Project, NYPL Labs
BIOLOGY/SCIENCE
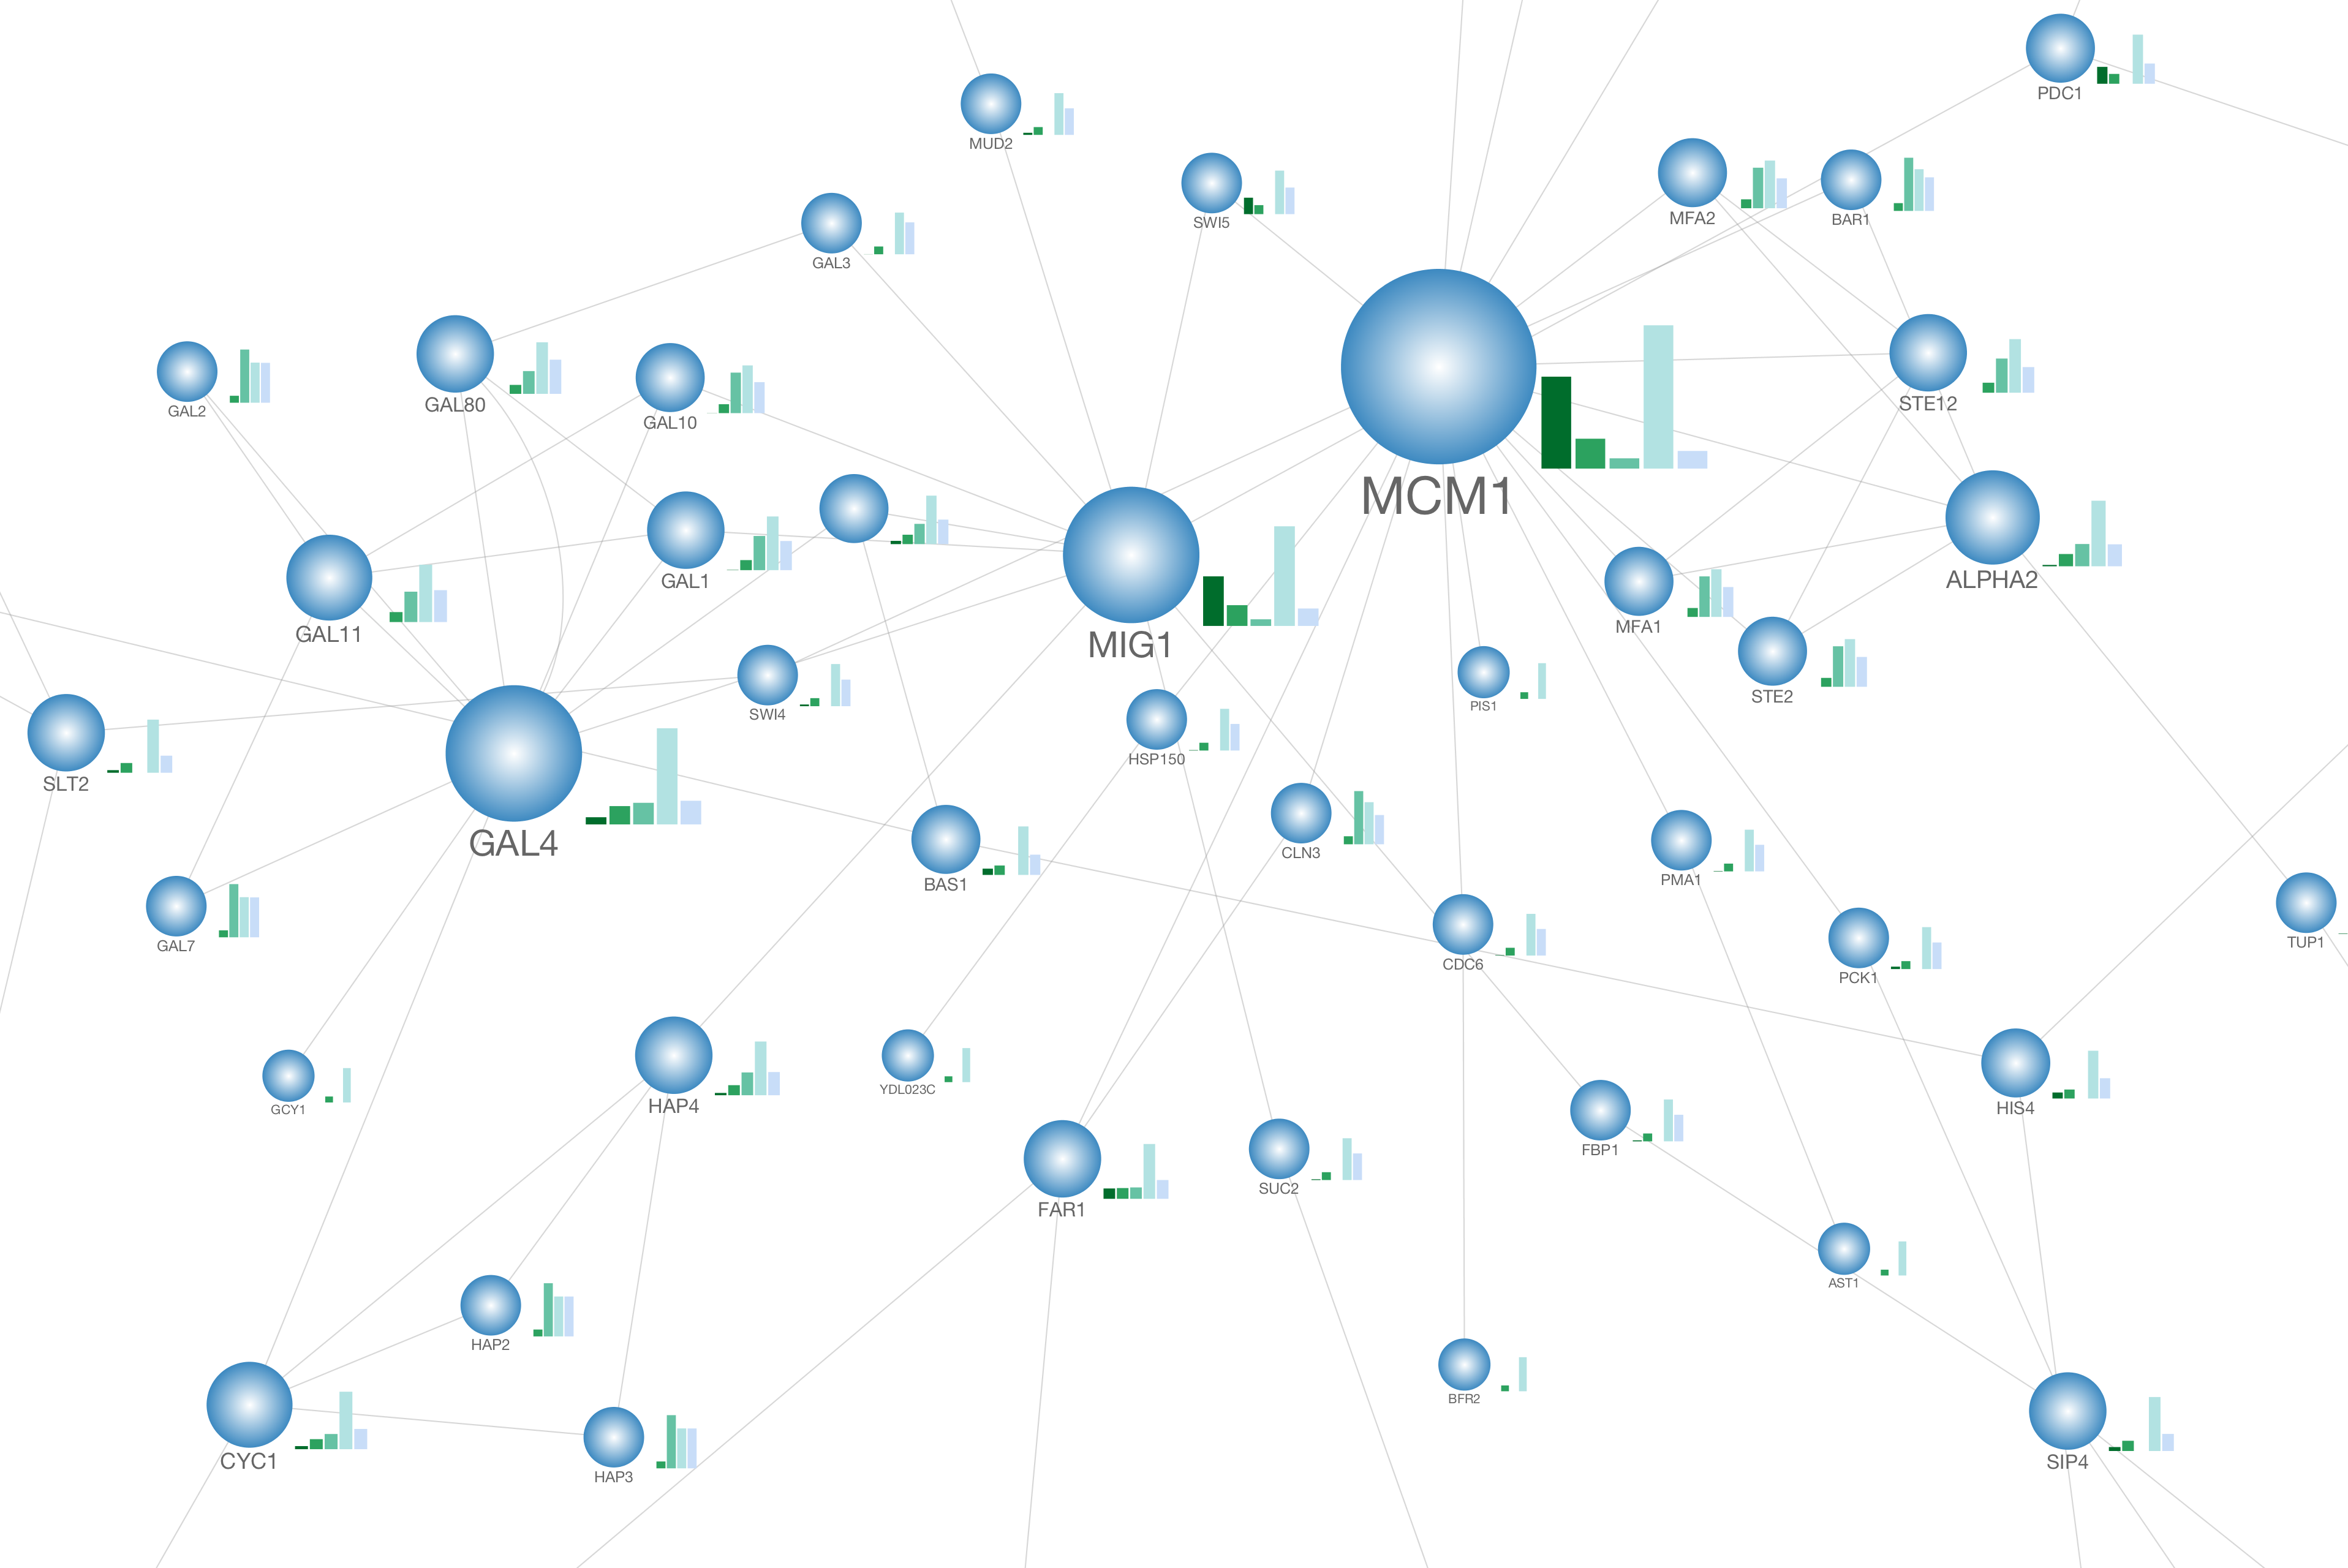
Gene Ontology Data, Damian Kao
- Explanation: http://blog.nextgenetics.net/?e=19
- Demo: http://blog.nextgenetics.net/demo/entry0019/demo.zip
- Demo: http://blog.nextgenetics.net/demo/entry0019/demo.html
MUSIC
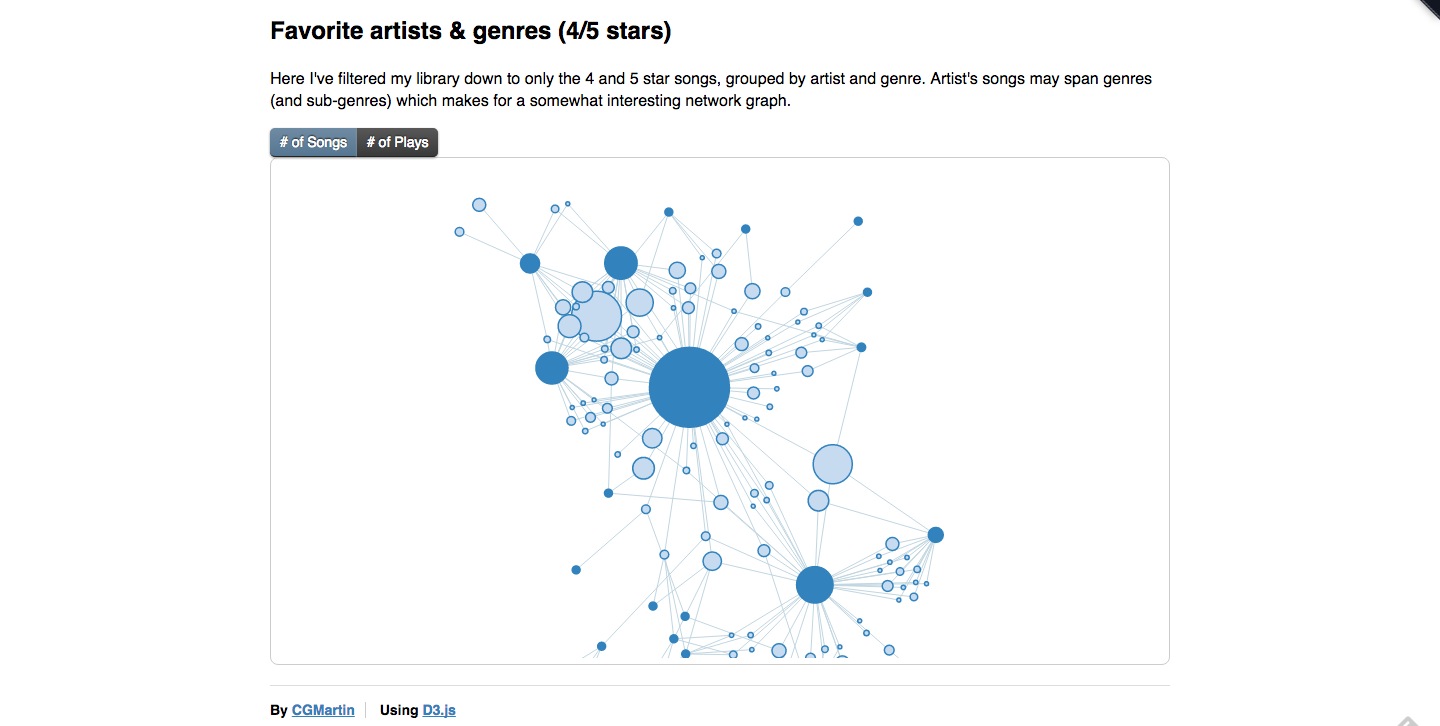
iTunes Library Graph, Christopher Martin
- Code: http://cgmartin.com/itunes-library-network-graph/
- Demo: https://github.com/cgmartin/iTunes-Library-Network-Graph
SOCIAL NETWORKS
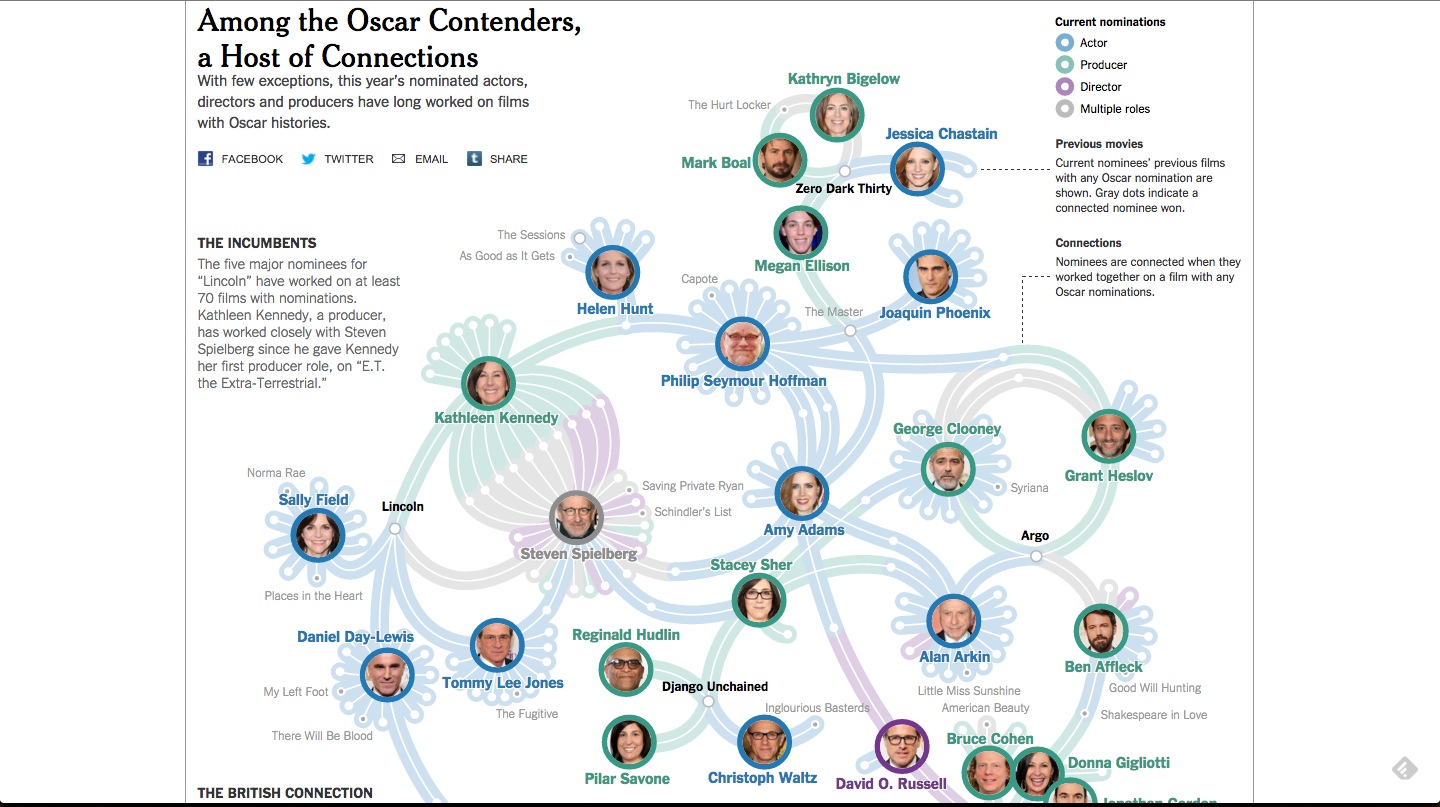
Oscar Article, NYTimes, Mike Bostock
- Explanation: http://emptypipes.org/2015/02/15/selectable-force-directed-graph/
- Demo: http://www.nytimes.com/interactive/2013/02/20/movies/among-the-oscar-contenders-a-host-of-connections.html
POLITICAL NETWORKS
- Explanation: http://www.informationisbeautiful.net/2014/who-likes-whom-in-the-middle-east-key-players-relationships/
- Data: http://bit.ly/KIB_MiddleEast
- Demo: http://www.informationisbeautiful.net/visualizations/islamic-sects-schools-branches-movements/
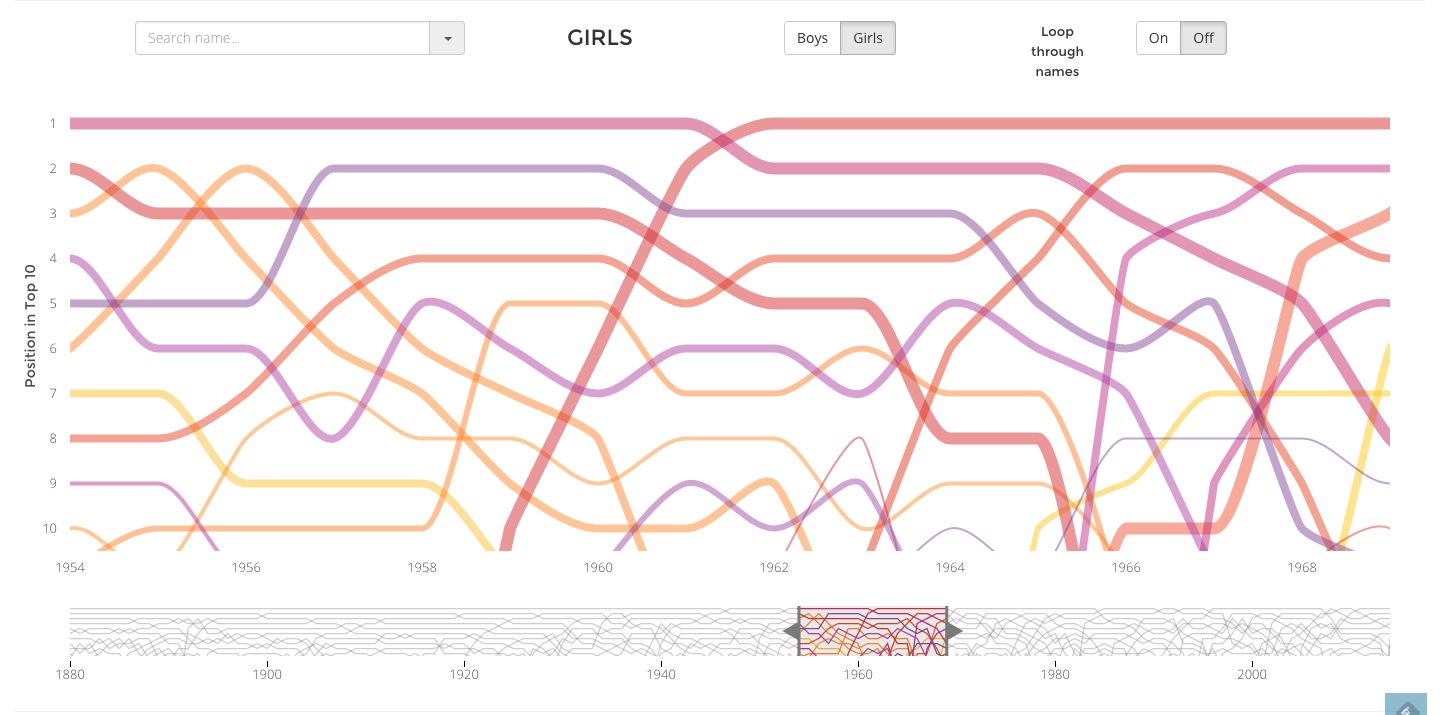
Things like the inspiration graph for this week, and this Baby Name Graph, are pseudo-graphical, but not quite like the examples above because they show layers of data relative to time factors, but do not illustrate intersection points between the lines, or how babynames have "mutated/merged/interacted," which would bring you closer to a graph visualizations.
There are lots of ways to approach graph information, you can use Javascript and D3 to draw your graph, or you can use a library/framework that specializes in graph information.
- Sigma.JS
- Arbor.JS
- Gephi
- D3: data driven documents, loads of examples of graph/force-directed visualizations here
- RelFinder
- GraphSub: a JS plugin for D3 JS
Check out some of the examples in each of those libraries, and see if you can play with the data they provide to make something that is useful to you.
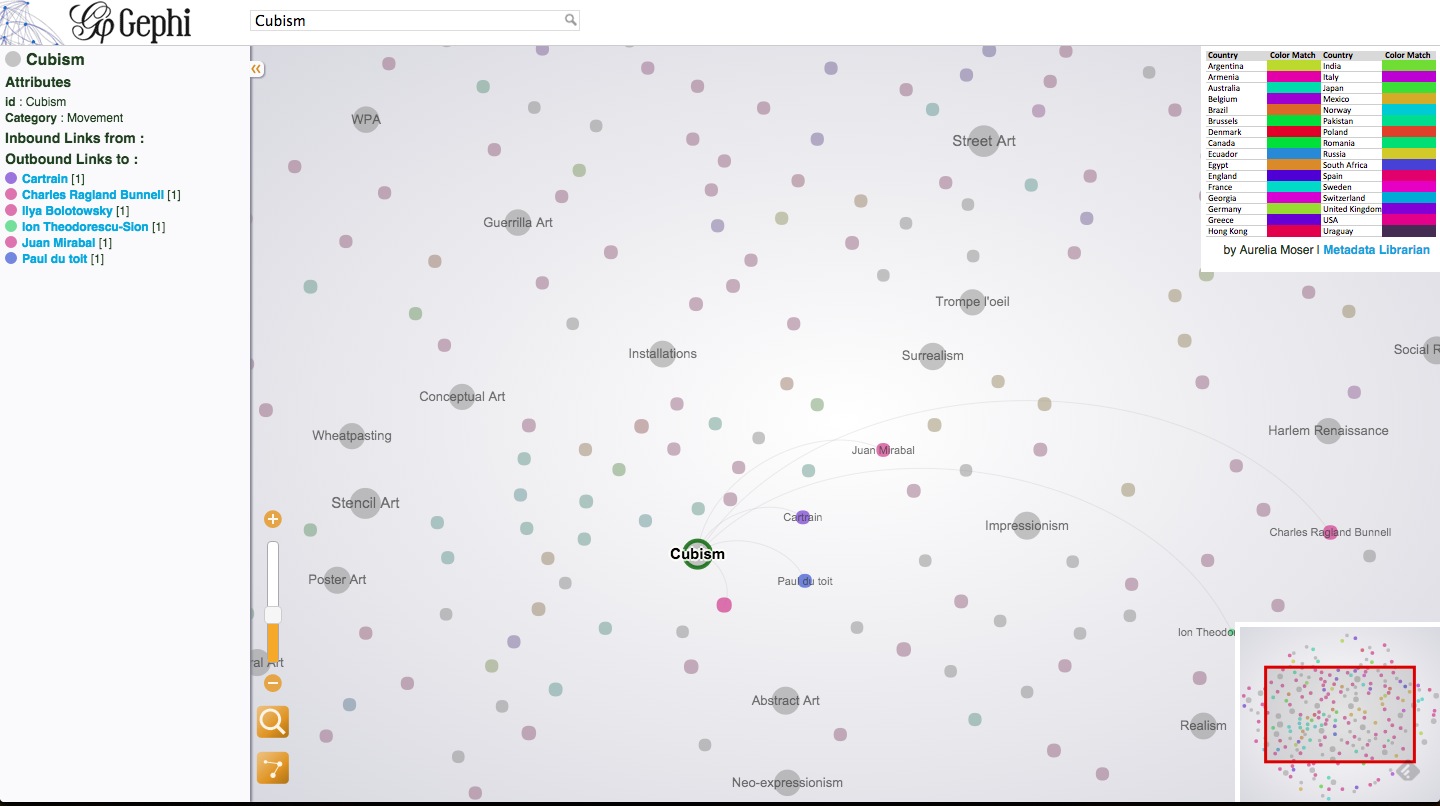
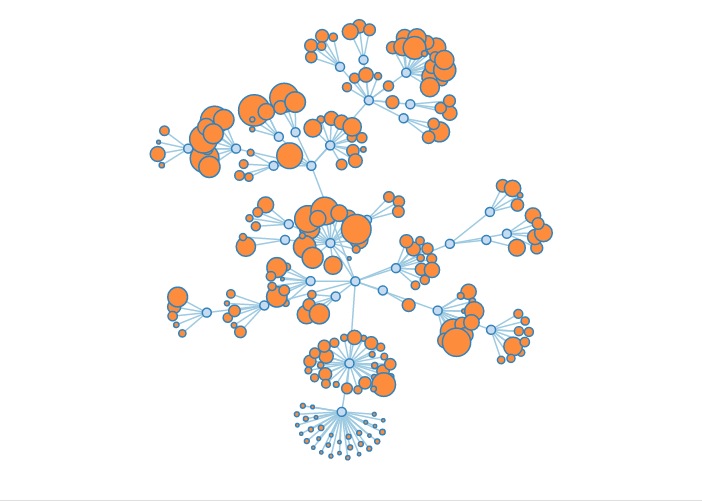
This visualization uses data from Freebase about Graffiti artists and the art movements they list has influencing their work. It uses Gexf, which is a javascript wrapper for Gephi, and uses color to indicate the artists' country of origin.
Source + Target columns in an excel file fed the construction of the graph in Gephi, the desktop application, and then the wrapper allowed me to display it on the web.
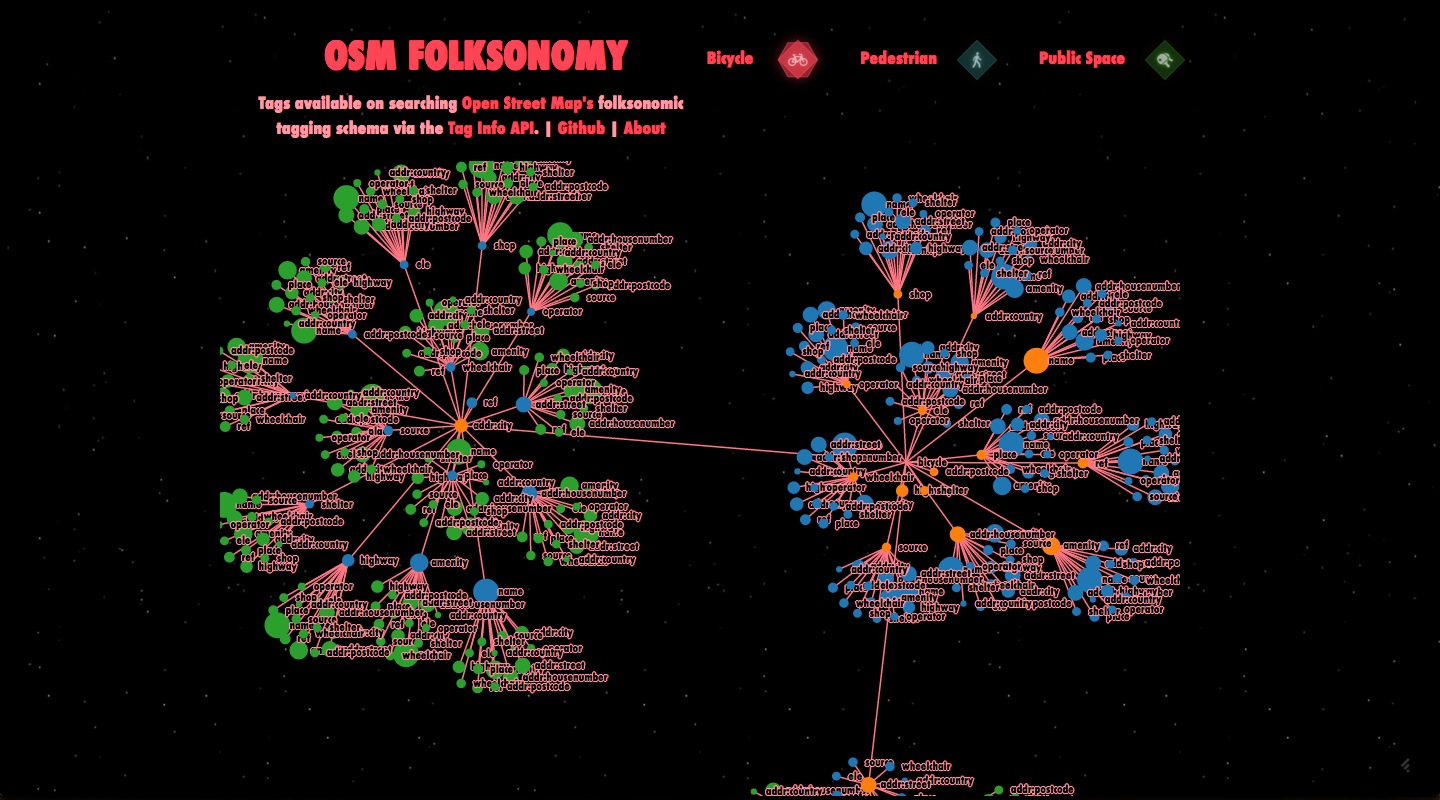
This visualization used D3 to draw a graph representing the myriad OSM tags related to "bicycle" in the Open Street Map Tag Library. We wanted to work on collecting data for Public Space and Pedestrian data too but the tags were way too messy.
There are loads of bl.ocks made for Graph information should you want to use D3, unfortunately, warning: the data format can be a bit tough, but if you have data to support this kind of structure, let me know and we can talk about working with it for your final projects.
- Draw your own Graph
- Directional Force Layout
- Force-directed Graph Demo
- Expand/collapse force layout
- Weighted Collapsable Force Layout
- Tarot Card Reader?
- D3.forcebundle
- Short Tutorial on Getting Started with D3 Graphs.
- Krempel, L., Network Visualization.
- Tamassia, R., Handbook of graph drawing and visualization.
- Tarawneh, R.M., et al., A general introduction to graph visualization techniques.
