Created
May 9, 2020 06:01
-
-
Save aviatesk/644d86ec9690f5f00a2228538bb0a8f3 to your computer and use it in GitHub Desktop.
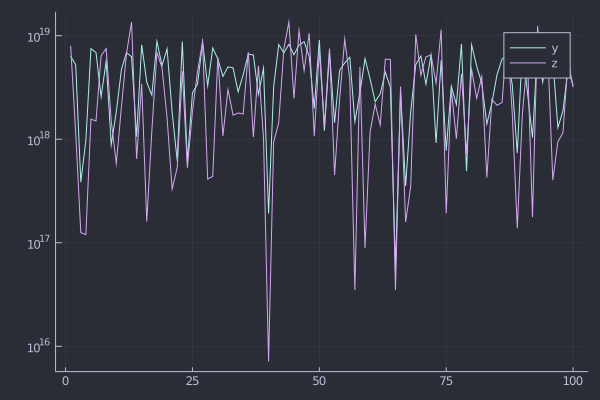
dataframe chaining while plotting
This file contains bidirectional Unicode text that may be interpreted or compiled differently than what appears below. To review, open the file in an editor that reveals hidden Unicode characters.
Learn more about bidirectional Unicode characters
| # what I will do here: | |
| # - dataframe chain | |
| # - keep to pass dataframe while plotting with `StatsPlots.@df` | |
| # - pass columns names as variables | |
| using DataFrames, Pipe, StatsPlots | |
| theme(:juno) | |
| df = DataFrame(x = randn(100), y = rand(Int, 100)) | |
| v1, v2 = :x, :y | |
| v3 = :z | |
| @pipe df |> | |
| transform(_, [v1, v2] => ((x,y)->(x.*y)) => v3) |> | |
| abs.(_) |> | |
| (@df _ plot(cols(v2); label = ^(v2)); _) |> # keep to pass dataframe while plotting | |
| @df _ plot!(cols(v3); yscale = :log10, label = ^(v3)) # more plotting | |
| savefig("fig.png") |
Author
aviatesk
commented
May 9, 2020
Sign up for free
to join this conversation on GitHub.
Already have an account?
Sign in to comment