Last active
October 9, 2020 12:24
-
-
Save aviatesk/68a6734a44a6408a6db380cf8bc1cce2 to your computer and use it in GitHub Desktop.
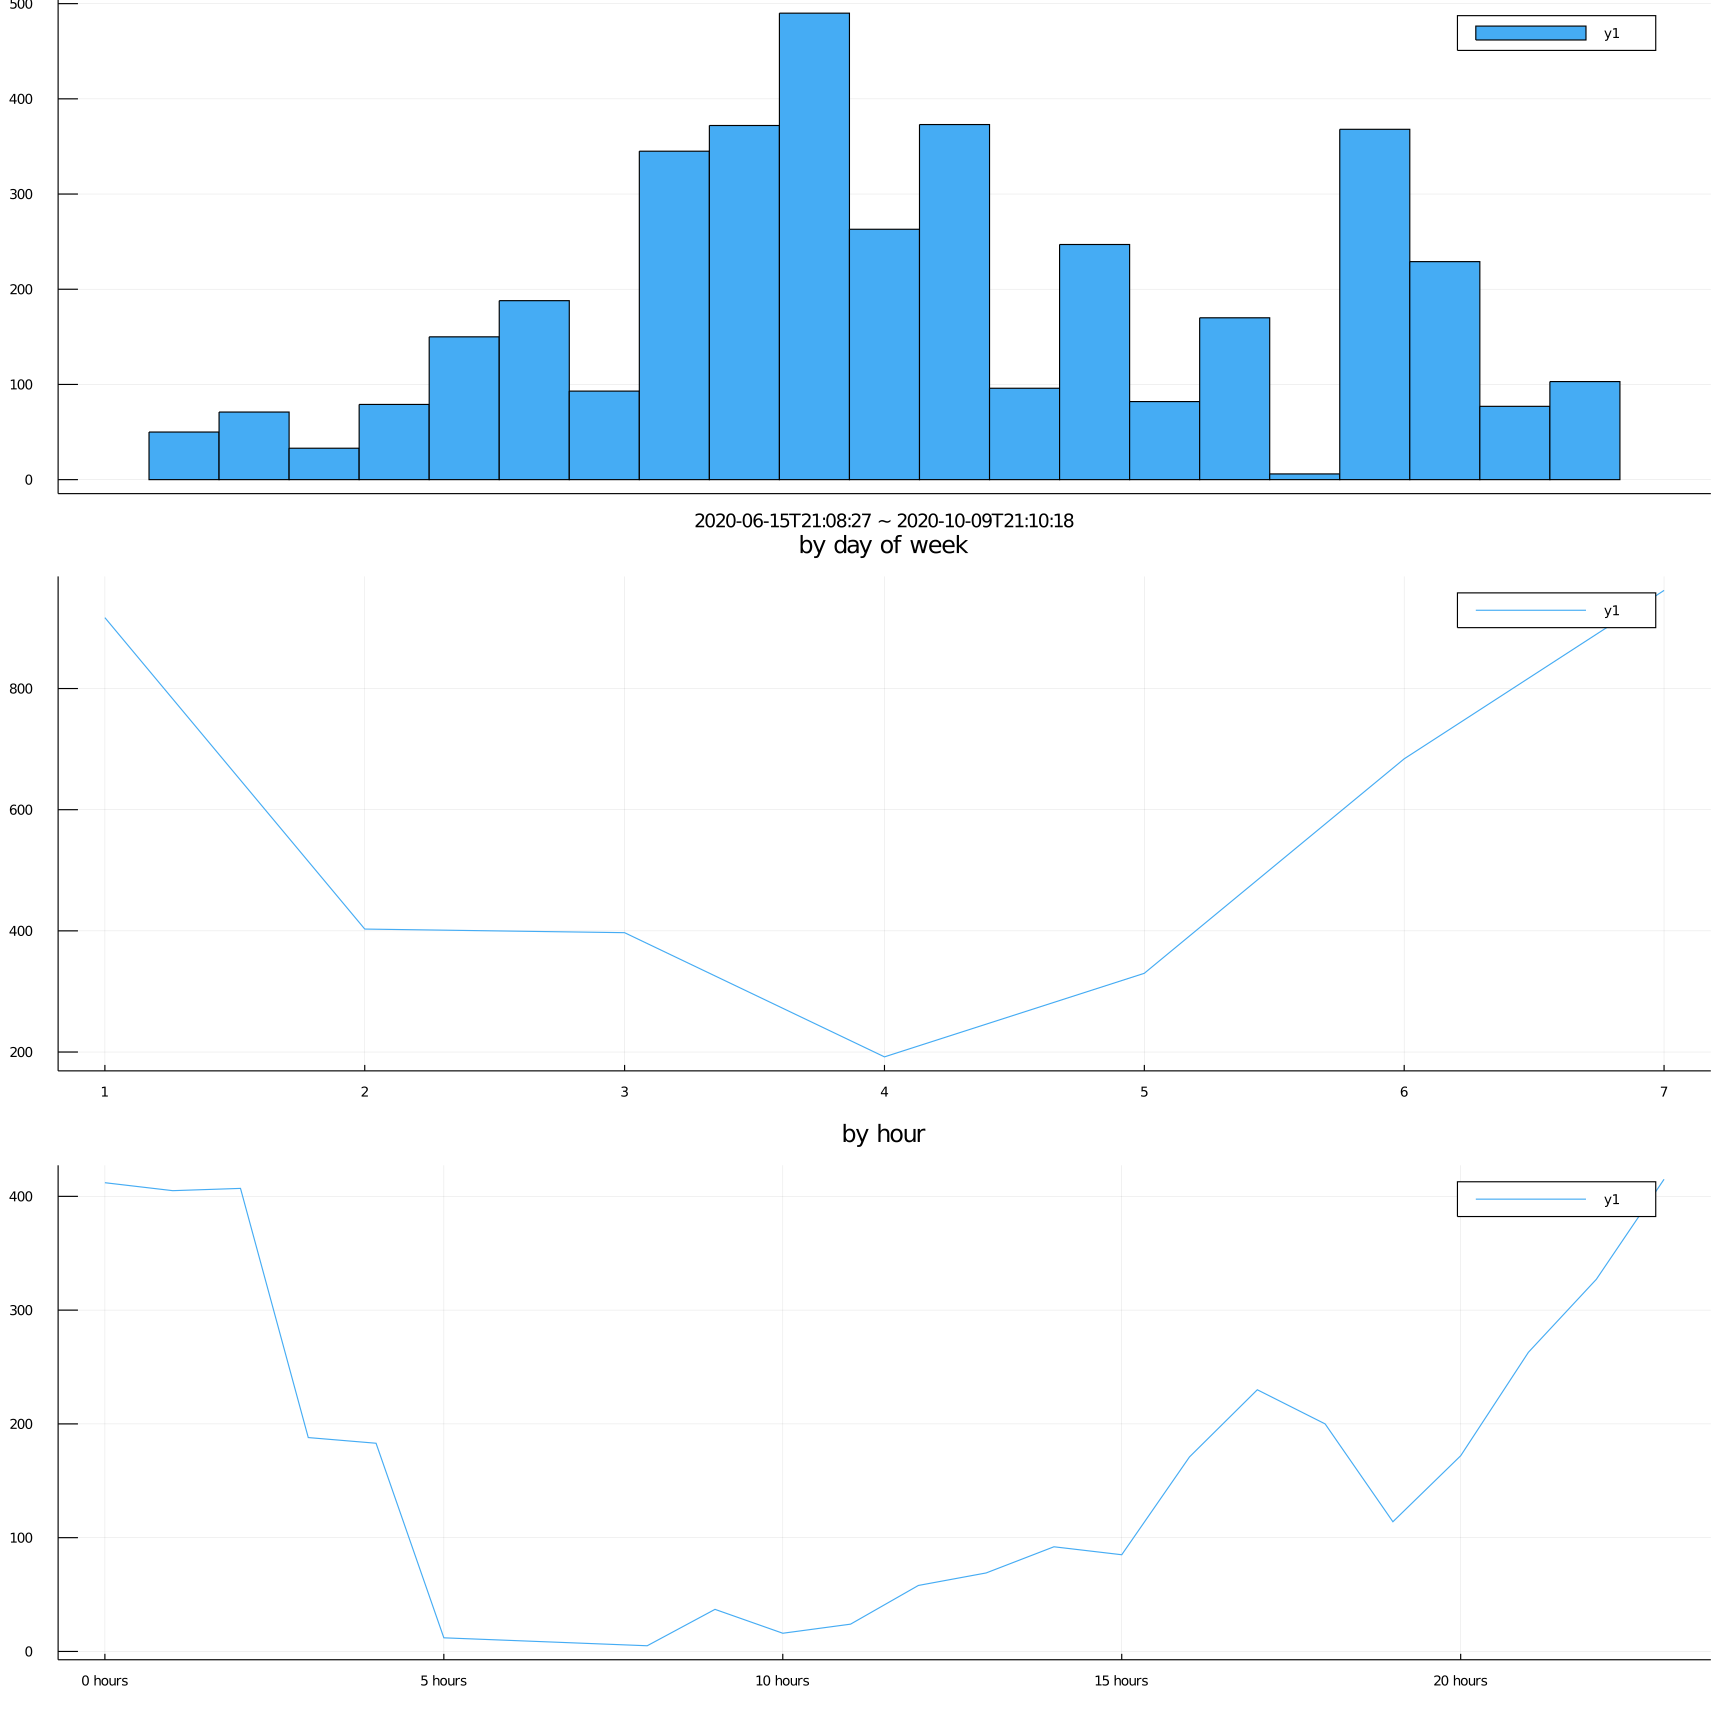
plot julia repl usage
This file contains bidirectional Unicode text that may be interpreted or compiled differently than what appears below. To review, open the file in an editor that reveals hidden Unicode characters.
Learn more about bidirectional Unicode characters
| using Dates, DataFrames, Pipe, Plots | |
| df = let | |
| ds = DateTime[] | |
| r = r"# time: (?<datetime>\d{4}-\d{2}-\d{2} \d{2}:\d{2}:\d{2})" | |
| for line in readlines(normpath(homedir(), ".julia/logs/repl_history.jl")) | |
| m = match(r, line) | |
| isnothing(m) || push!(ds, DateTime(m[:datetime], dateformat"Y-m-d H:M:S")) | |
| end | |
| DataFrame(datetime = ds) | |
| end | |
| let | |
| histogram(df.datetime, xticks = nothing) | |
| p1 = xlabel!(string(minimum(ds), " ~ ", maximum(ds))) | |
| p2 = @pipe df |> | |
| transform(_, :datetime => ByRow(dayofweek) => :dow) |> | |
| groupby(_, :dow) |> | |
| combine(_, nrow) |> | |
| sort(_, :dow) |> | |
| plot(_.dow, _.nrow, title = "by day of week") | |
| p3 = @pipe df |> | |
| transform(_, :datetime => ByRow(Hour) => :hour) |> | |
| groupby(_, :hour) |> | |
| combine(_, nrow) |> | |
| sort(_, :hour) |> | |
| plot(_.hour, _.nrow, title = "by hour") | |
| plot(p1, p2, p3, size = (1500,1500), layout = (3, 1)) | |
| end |
Author
aviatesk
commented
Oct 9, 2020
Sign up for free
to join this conversation on GitHub.
Already have an account?
Sign in to comment