-
-
Save benmarwick/b2d0073fc2268cbd4a0e5e555c39eb7c to your computer and use it in GitHub Desktop.
This file contains bidirectional Unicode text that may be interpreted or compiled differently than what appears below. To review, open the file in an editor that reveals hidden Unicode characters.
Learn more about bidirectional Unicode characters
| # function to do a dodged half-boxplot and jittered points next to each other | |
| # | |
| # data_in should be a data frame | |
| # factor_col should be a bare column name (not a string) | |
| # although it will work if that column is factor or a character type | |
| # numeric_col is the y axis continuous variable | |
| # offset is the width of the boxplots and jittered point cloud | |
| # | |
| # the basic approach is to draw a boxplot without the tails | |
| # (e.g. only the interquartile range) and then use segments to add the | |
| # min and max values | |
| # | |
| # in part based on ideas here: | |
| # https://groups.google.com/forum/#!topic/ggplot2/jAyiMHf7DPU | |
| # http://ggplot2.tidyverse.org/reference/geom_boxplot.html | |
| library("rlang") | |
| library("dplyr") | |
| library("ggplot2") | |
| library("ggbeeswarm") | |
| gg_jitterbox <- function(data_in, factor_col, numeric_col, offset) { | |
| # turn bare args into quosures | |
| quo_factor <- enquo(factor_col) | |
| quo_numeric <- enquo(numeric_col) | |
| # do the base R stuff that doesn't play nice with quosures | |
| # the extra factor() call deals with the factor_col parameter potentially | |
| # being character type - otherwise finding levels() etc will fail | |
| # quo_text(quo_factor) just gives back the string of the column name that we | |
| # put as a bare parameter | |
| numeric_factor <- as.numeric(factor(data_in[[quo_text(quo_factor)]])) | |
| ftr_breaks <- seq(length(levels(factor(data_in[[quo_text(quo_factor)]])))) | |
| ftr_labels <- levels(factor(data_in[[quo_text(quo_factor)]])) | |
| # easiest to do this first bit with dplyr instead of pulling out | |
| # of the ggplot object, because we then only have to call ggplot() once | |
| data_in %>% | |
| # another check to make sure we have factors when expected | |
| mutate_if(is.character, as.factor) %>% | |
| # !! unquotes quosures, but only works well with tidyverse | |
| group_by(!!quo_factor) %>% | |
| mutate(d_ymin = min(!!quo_numeric), | |
| d_ymax = max(!!quo_numeric), | |
| d_lower = quantile(!!quo_numeric, 0.25), | |
| d_middle = median(!!quo_numeric), | |
| d_upper = quantile(!!quo_numeric, 0.75)) %>% | |
| ggplot() + | |
| # aes_() requires quoted formula types, but allows mixing | |
| # of enquo-ed bare names (e.g. quo_factor) and just | |
| # normal dplyr-style column names | |
| geom_boxplot(aes_(x = ~numeric_factor - offset, | |
| ymin = ~d_lower, | |
| ymax = ~d_upper, | |
| lower = ~d_lower, | |
| middle = ~d_middle, | |
| upper = ~d_upper, | |
| width = 2 * offset, | |
| fill = quo_factor), | |
| stat = "identity") + | |
| geom_quasirandom(aes_(x = ~numeric_factor + offset, | |
| y = quo_numeric, | |
| color = quo_factor), | |
| width = offset - 0.25 * offset, | |
| height = 0) + | |
| # bottom vertical segment | |
| geom_segment(aes(x = numeric_factor, | |
| y = d_ymin, | |
| xend = numeric_factor, | |
| yend = d_lower)) + | |
| # top vertical segment | |
| geom_segment(aes(x = numeric_factor, | |
| y = d_ymax, | |
| xend = numeric_factor, | |
| yend = d_upper)) + | |
| # top horizontal segment | |
| geom_segment(aes(x = numeric_factor - offset, | |
| y = d_ymax, | |
| xend = numeric_factor, | |
| yend = d_ymax)) + | |
| # top vertical segment | |
| geom_segment(aes(x = numeric_factor - offset, | |
| y = d_ymin, | |
| xend = numeric_factor, | |
| yend = d_ymin)) + | |
| # have to manually add in the x scale because we made everything numeric | |
| # to do the shifting | |
| scale_x_continuous(breaks = ftr_breaks, | |
| labels = ftr_labels) + | |
| # this also needs to be added manually because of the change to numeric | |
| labs(x = quo_text(quo_factor)) | |
| } | |
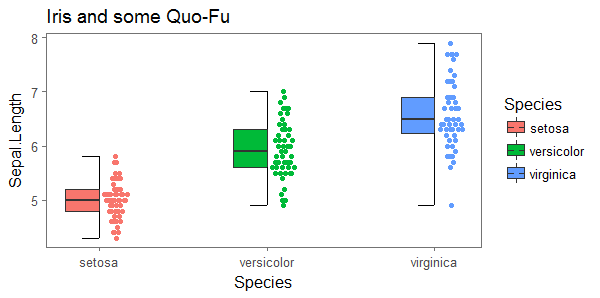
| # example with factor column stored as factor | |
| gg_jitterbox(data_in = iris, | |
| factor_col = Species, | |
| numeric_col = Sepal.Length, | |
| offset = 0.1) + | |
| ggtitle("Iris and some Quo-Fu") | |
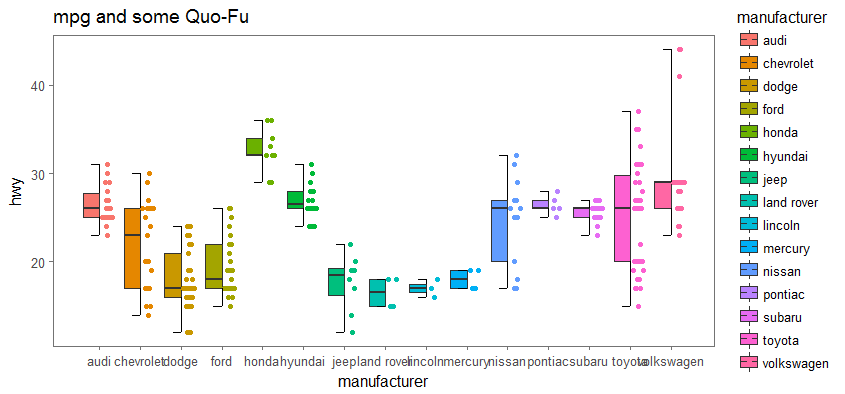
| # example with factor column stored as character | |
| gg_jitterbox(data_in = mpg, | |
| factor_col = manufacturer, | |
| numeric_col = hwy, | |
| offset = 0.2) + | |
| ggtitle("mpg and some Quo-Fu") |
Author
benmarwick
commented
Feb 21, 2018
Sign up for free
to join this conversation on GitHub.
Already have an account?
Sign in to comment