Last active
November 16, 2021 02:18
-
-
Save brainysmurf/e45f608b68609f8a0b222ac99b8905d8 to your computer and use it in GitHub Desktop.
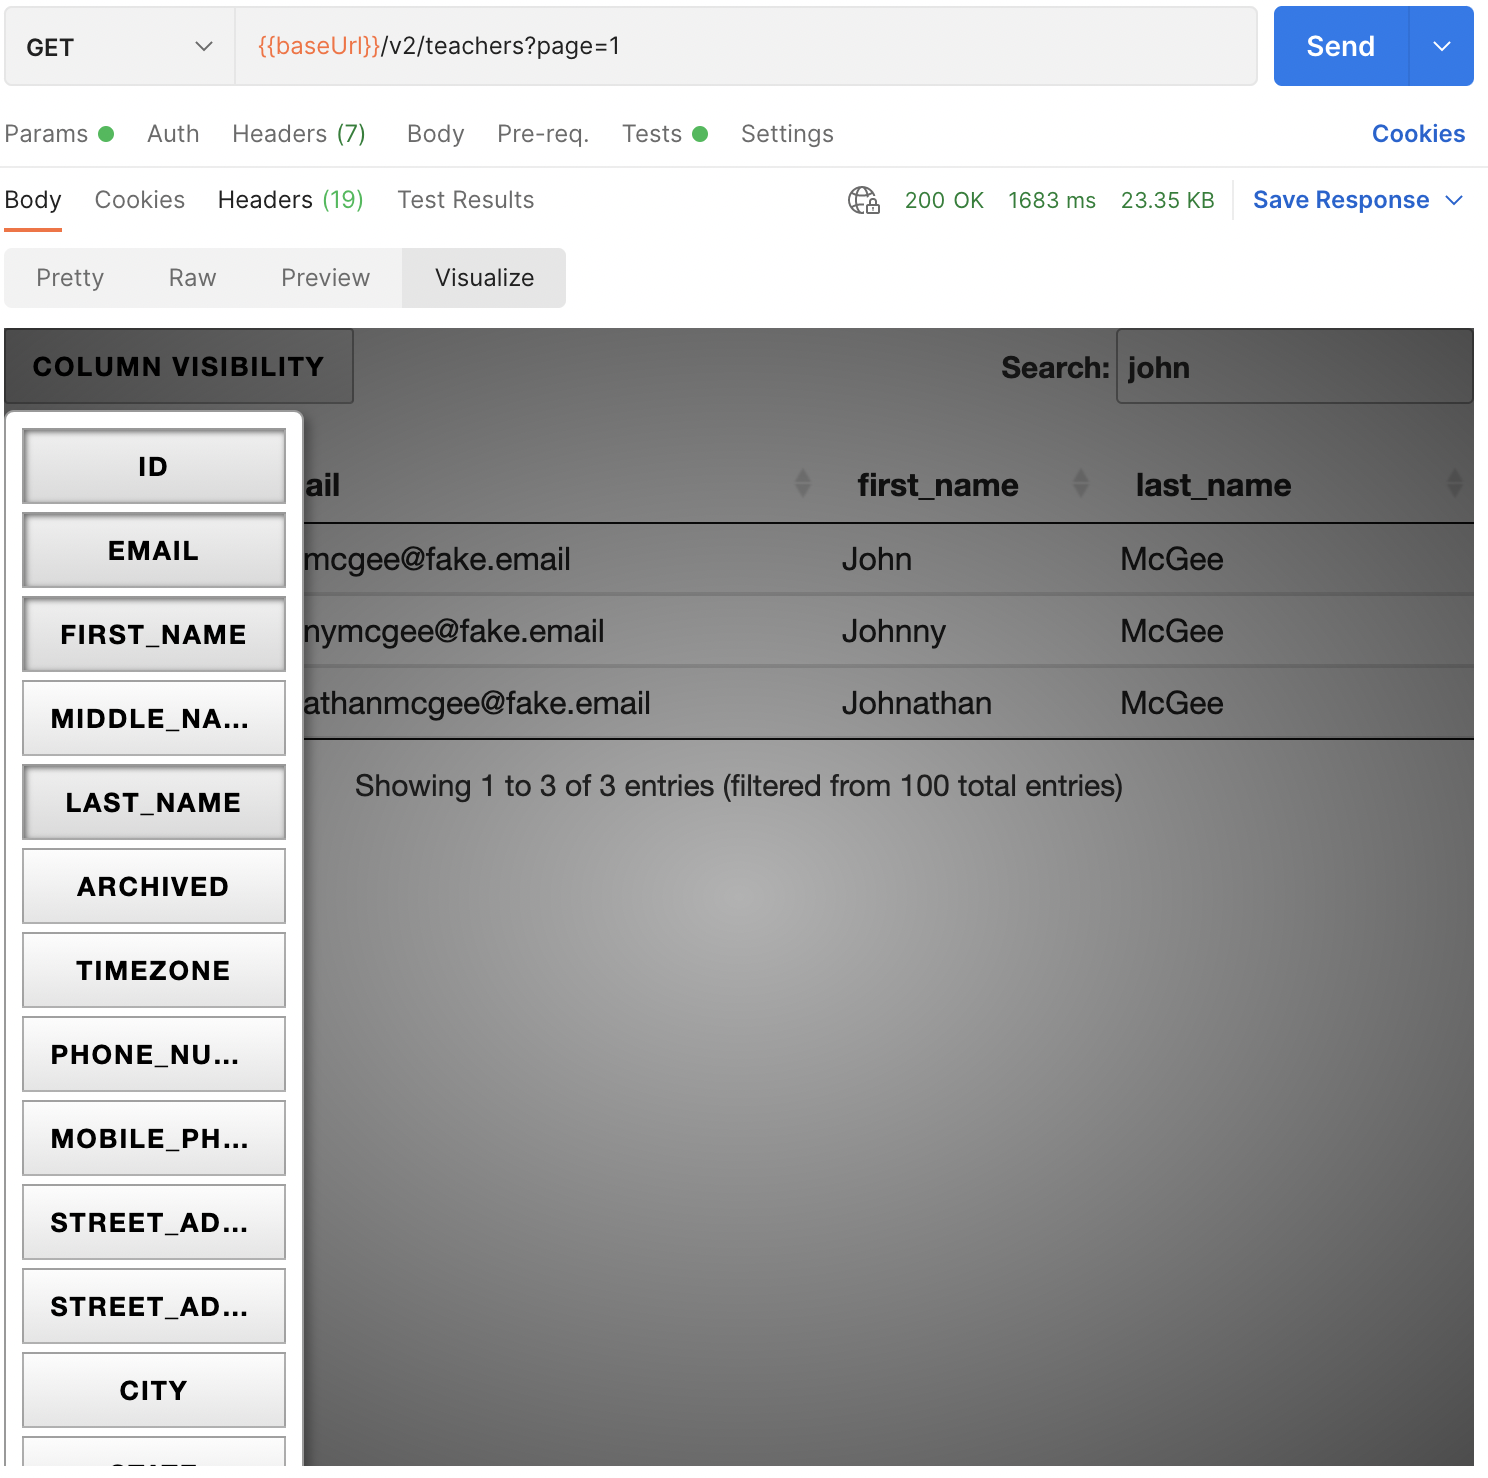
Use datatables.net from within Postman as visualizer
This file contains bidirectional Unicode text that may be interpreted or compiled differently than what appears below. To review, open the file in an editor that reveals hidden Unicode characters.
Learn more about bidirectional Unicode characters
| /** | |
| * Get an overview table of all items returned from the endpoint, useful for when there lists of objects are returned. | |
| * See comments below for screenshots. | |
| * | |
| * https://gist.github.com/brainysmurf/e45f608b68609f8a0b222ac99b8905d8 | |
| * | |
| * To use, copy the below code into the "Tests" tab of the endpoint | |
| * Click blue "Send" button | |
| * Click on "Visualize" in the Body tile | |
| * Note that it only displays the returned objects, there's nothing magical that's getting "all" objects via pagination | |
| */ | |
| // change to whatever the root property is "students" "year-groups" whatever | |
| const entity = "teachers"; | |
| // change to the fields you want displayed at first, you can add others interactively | |
| const columns = ['id', 'first_name', 'last_name', 'email']; | |
| /** | |
| * Below not intended for modification (although you can, for version bumps etc) | |
| */ | |
| const template = ` | |
| <link rel="stylesheet" href="https://cdn.datatables.net/1.10.25/css/jquery.dataTables.min.css"> | |
| <link rel="stylesheet" href="https://cdn.datatables.net/buttons/1.7.1/css/buttons.dataTables.min.css"> | |
| <link re="stylesheet" href="https://cdn.datatables.net/colreorder/1.5.4/css/colReorder.dataTables.min.css"> | |
| <table id="target" class="stripe row-border order-column" style="width:100%"></table> | |
| <script src="https://code.jquery.com/jquery-3.5.1.min.js"></script> | |
| <script src="https://cdn.datatables.net/1.10.25/js/jquery.dataTables.min.js"></script> | |
| <script src="https://cdn.datatables.net/1.10.25/js/dataTables.jquery.min.js"></script> | |
| <script src="https://cdn.datatables.net/buttons/1.7.1/js/dataTables.buttons.min.js"></script> | |
| <script src="https://cdn.datatables.net/buttons/1.7.1/js/buttons.jquery.min.js"></script> | |
| <script src="https://cdn.datatables.net/buttons/1.7.1/js/buttons.colVis.min.js"></script> | |
| <script src="https://cdn.datatables.net/colreorder/1.5.4/js/dataTables.colReorder.min.js"></script> | |
| <script> | |
| const show_columns_by_default = ["${columns.toString().split(',').join('","')}"]; | |
| pm.getData( (err, {${entity}: data}) => { | |
| const columns = data.map(Object.keys).flat() | |
| .filter( (value, index, self) => self.indexOf(value)===index) | |
| .map(key => ({visible: show_columns_by_default.includes(key), title: key, data: key, defaultContent: '-'})); | |
| $('#target').DataTable({ | |
| buttons: ['colvis'], | |
| dom: 'Bfrtip', | |
| scrollX: true, | |
| scrollCollapse: true, | |
| paging: false, | |
| ordering: true, | |
| data, | |
| columns | |
| }); | |
| }); | |
| </script> | |
| <style> | |
| /* Ensure that the demo table scrolls */ | |
| th, td { white-space: nowrap; } | |
| div.dataTables_wrapper { | |
| margin: 0 auto; | |
| } | |
| </style> | |
| `; | |
| // Set visualizer with template defined below (via hoisting) | |
| const json = pm.response.json(); | |
| pm.visualizer.set(template, pm.response.json()); |
Author
brainysmurf
commented
Oct 24, 2021

Sign up for free
to join this conversation on GitHub.
Already have an account?
Sign in to comment