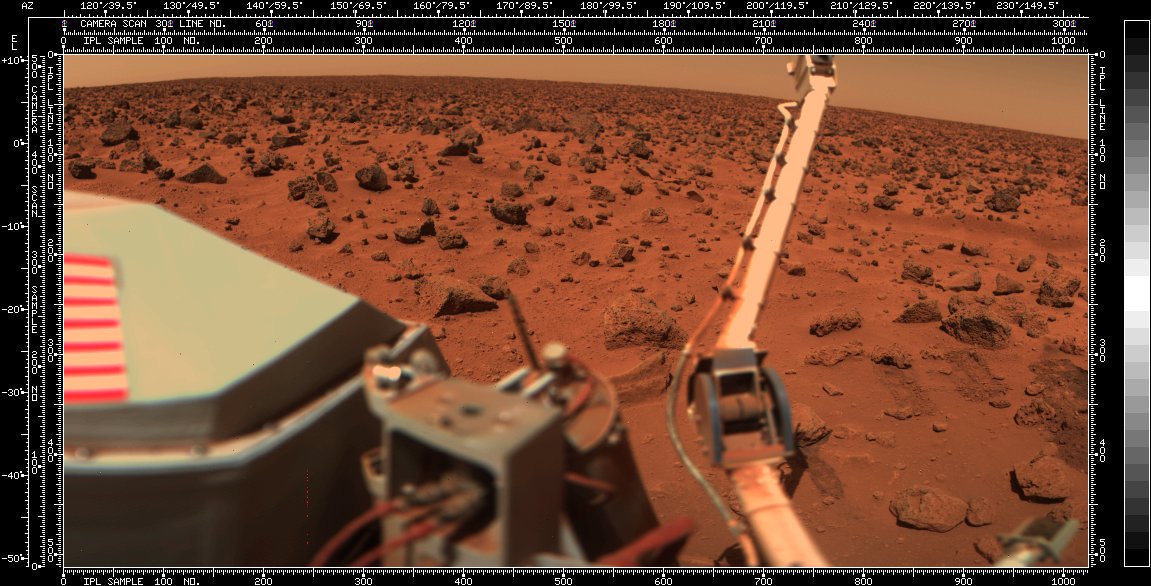
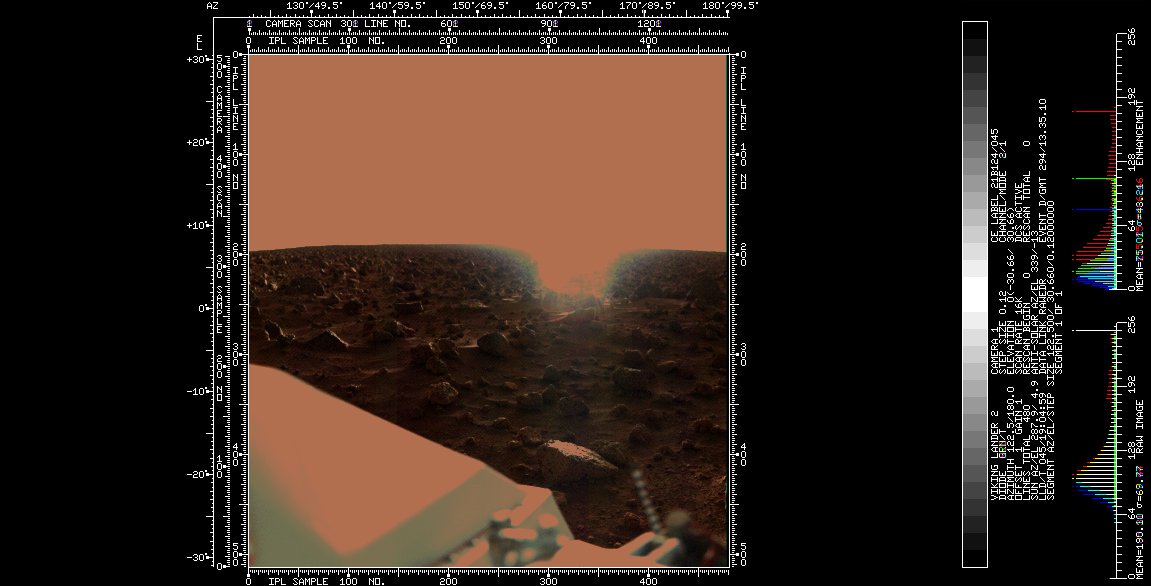
Bruno Sánchez-Andrade Nuño brunosan
brunosan
/ images-mars-viking-1976.md
Last active
August 29, 2015 14:07
— forked from jakeogh/gist:fa995a3277d500ab59b1
brunosan
/ index.html
Last active
August 29, 2015 14:02
— forked from d3noob/index.html
This file contains bidirectional Unicode text that may be interpreted or compiled differently than what appears below. To review, open the file in an editor that reveals hidden Unicode characters.
Learn more about bidirectional Unicode characters
| <!DOCTYPE html> | |
| <html> | |
| <head> | |
| <title>Leaflet.draw Plugin</title> | |
| <meta charset="utf-8" /> | |
| <link | |
| rel="stylesheet" | |
| href="http://cdn.leafletjs.com/leaflet-0.7/leaflet.css" | |
| /> | |
| <link |
brunosan
/ subsample.py
Created
March 21, 2014 00:46
— forked from sgillies/subsample.py
This file contains bidirectional Unicode text that may be interpreted or compiled differently than what appears below. To review, open the file in an editor that reveals hidden Unicode characters.
Learn more about bidirectional Unicode characters
| import rasterio | |
| import numpy as np | |
| src = rasterio.open('/Users/sean/code/decloud/envs/1_16/output/0_q.tif') | |
| # Fraction of elements with value > 100 at full resolution. | |
| q = src.read_band(1) | |
| ones = np.ones(q.shape) | |
| print "Full, %d pixels" % (q.shape[0]*q.shape[1]) | |
| print sum(ones[q>100])/(q.shape[0]*q.shape[1]) |
brunosan
/ install_postgis_osx.sh
Last active
August 29, 2015 13:57
— forked from lucasallan/install_postgis_osx.sh
Install and run a postgis in mavericks
This file contains bidirectional Unicode text that may be interpreted or compiled differently than what appears below. To review, open the file in an editor that reveals hidden Unicode characters.
Learn more about bidirectional Unicode characters
| # Some good references are: | |
| # http://russbrooks.com/2010/11/25/install-postgresql-9-on-os-x | |
| # http://www.paolocorti.net/2008/01/30/installing-postgis-on-ubuntu/ | |
| # http://postgis.refractions.net/documentation/manual-1.5/ch02.html#id2630392 | |
| #1. Install PostgreSQL postgis and postgres | |
| brew install postgis | |
| initdb /usr/local/var/postgres | |
| pg_ctl -D /usr/local/var/postgres -l /usr/local/var/postgres/server.log start |
brunosan
/ landsat-band-mappings.md
Created
October 30, 2013 18:09
— forked from hrwgc/landsat-band-mappings.md
| Landsat 4-5 | Wavelength | Landsat 7 | Wavelength | Landsat 8 | Wavelength (micrometers) |
|---|---|---|---|---|---|
| Band 1 - Coastal aerosol | 0.43 - 0.45 | ||||
| Band 1 | 0.45-0.52 | Band 1 | 0.45-0.52 | Band 2 - Blue | 0.45 - 0.51 |
| Band 2 | 0.52-0.60 | Band 2 | 0.52-0.60 | Band 3 - Green | 0.53 - 0.59 |
| Band 3 | 0.63-0.69 | Band 3 | 0.63-0.69 | Band 4 - Red | 0.64 - 0.67 |
| Band 4 | 0.76-0.90 | Band 4 | 0.77-0.90 | Band 5 - Near Infrared (NIR) | 0.85 - 0.88 |
| Band 9 - Cirrus | 1.36 - 1.38 | ||||
| Band 5 | 1.55-1.75 | Band 5 | 1.55-1.75 | Band 6 - SWIR 1 | 1.57 - 1.65 |
| Band 7 | 2.08-2.35 | Band 7 | 2.09-2.35 | Band 7 - SWIR 2 | 2.11 - 2.29 |
brunosan
/ gist:4178894
Created
November 30, 2012 21:45
— forked from lxbarth/gist:4178351
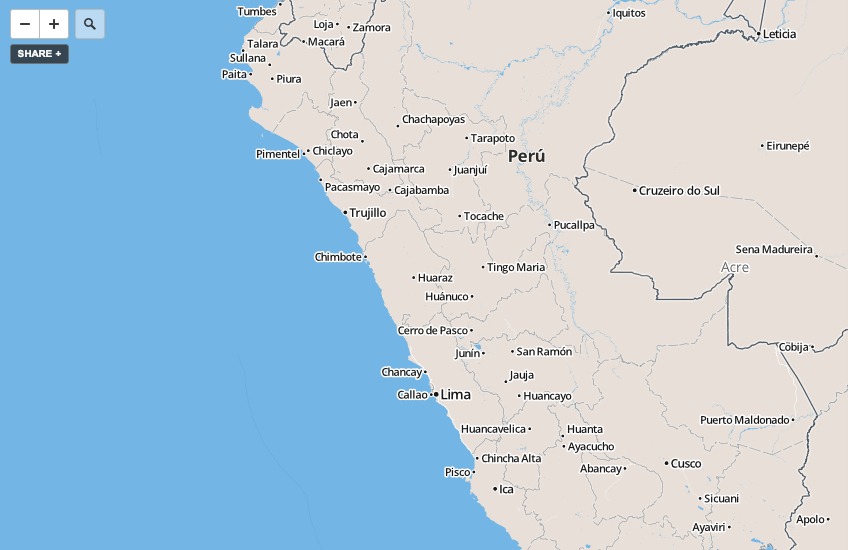
Ayacucho **minor** language edits
layout: blog category: blog published: true title: "Mapas Dinámicos Rápidos con OpenStreetMap, MapBox.js y Google Spreadsheets" subtitle: "In time for Desarrollando América Latina: an example of quickly building a geo application with MapBox Streets, MapBox.js and Google Spreadsheets" permalink: /blog/aplicacion-mapas-rapido image: http://farm9.staticflickr.com/8210/8224404737_523aca1954_o.jpg tags:
- Ruben Lopez Mendoza
brunosan
/ togeo.py
Created
August 29, 2012 19:10
— forked from tmcw/togeo.py
geo-assign any arbitrary image to a geotiff usable in tilemill
This file contains bidirectional Unicode text that may be interpreted or compiled differently than what appears below. To review, open the file in an editor that reveals hidden Unicode characters.
Learn more about bidirectional Unicode characters
| import subprocess | |
| import sys, re | |
| MERC = '+proj=merc +a=6378137 +b=6378137 +lat_ts=0.0 +lon_0=0.0 +x_0=0.0 +y_0=0 +k=1.0 +units=m +nadgrids=@null +wktext +no_defs' | |
| infile = sys.argv[1] | |
| info_output = subprocess.Popen(['gdalinfo', infile], stdout=subprocess.PIPE).communicate()[0] | |
| size_is_re = re.compile('Size is (?P<width>\d+), (?P<height>\d+)') | |
| size_is = filter(lambda x: x, map(lambda x: size_is_re.match(x), info_output.split('\n'))) |