|
import sys |
|
|
|
import numpy as np |
|
import matplotlib.pyplot as plt |
|
|
|
# Means of TIMES batches of LIM rolls of NDICE dice of DIM sides. |
|
def nmeans(times, lim, ndice, dim): |
|
a = np.empty(times) |
|
r = np.random.randint(1, dim * ndice + 1, (lim * times,)) |
|
# mean of each slice of lim elements (TIMES slices) |
|
i = 0 |
|
while i < times: |
|
b = i * lim |
|
a[i] = np.mean(r[b : b+lim-1]) |
|
i += 1 |
|
return (times, lim, ndice, dim, a) |
|
|
|
|
|
def nmeans_for(times, lim, ndice, dim): |
|
a = np.empty(times) |
|
r = np.random.randint(1, dim * ndice + 1, (lim * times,)) |
|
# mean of each slice of lim elements (TIMES slices) |
|
for i in range(times): |
|
b = i * lim |
|
a[i] = np.mean(r[b : b+lim-1]) |
|
return (times, lim, ndice, dim, a) |
|
|
|
|
|
def plotmeans(data): |
|
_, _, ndice, dim, dat = data |
|
plt.hist(dat) |
|
plt.xlabel('mean') |
|
plt.xticks(range(1, ndice * dim + 1)) |
|
plt.ylabel('freq') |
|
plt.show() |
|
|
|
def bench(): |
|
from timeit import timeit |
|
|
|
nfor = [] |
|
nwhile = [] |
|
runs = [10, 100, 1000, 10_000, 100_000, 500_000, |
|
1_000_000, 5_000_000] |
|
|
|
def f(f, n): |
|
a = "_for" if f else "" |
|
return [ |
|
'nmeans%s(%d, 10, 2, 6)' % (a, n), |
|
'from dicerolls import nmeans%s' % (a,) |
|
] |
|
for i in runs: |
|
sys.stdout.write("%d batches, nmeans_for: " % (i,)) |
|
sys.stdout.flush() |
|
t0 = timeit(*f(True, i), number=1) |
|
print('%f sec' % (t0,)) |
|
|
|
sys.stdout.write("%d batches, nmeans: " % (i,)) |
|
sys.stdout.flush() |
|
t1 = timeit(*f(False, i), number=1) |
|
print('%f sec' % (t1,)) |
|
|
|
nfor.append(t0) |
|
nwhile.append(t1) |
|
|
|
# the plot |
|
r = len(runs) |
|
i = np.arange(r) |
|
w = 0.35 |
|
|
|
# log comparison |
|
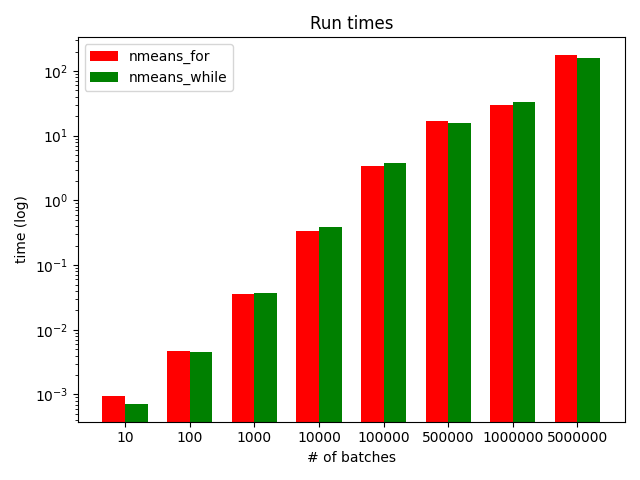
plt.bar(i, nfor, w, color='r', label='nmeans_for') |
|
plt.bar(i+w, nwhile, w, color='g', label='nmeans_while') |
|
plt.title('Run times') |
|
plt.xlabel('# of batches') |
|
plt.xticks(i+w/2, [str(i) for i in runs]) |
|
plt.ylabel('time (log)') |
|
plt.yscale('log') |
|
plt.legend() |
|
plt.tight_layout() |
|
plt.show() |
|
|
|
# time delta |
|
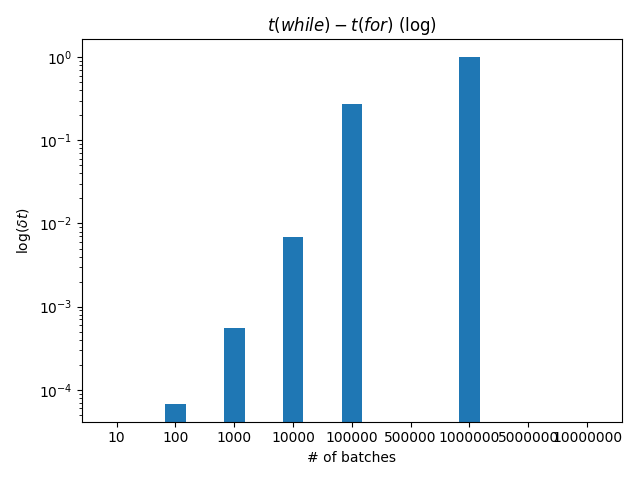
dt = [w - f for w, f in zip(nwhile, nfor)] |
|
plt.bar(i, dt, w) |
|
plt.title('$t(while)-t(for)$ (log)') |
|
plt.xlabel('# of batches') |
|
plt.xticks(i, [str(i) for i in runs]) |
|
plt.ylabel('$\log(\delta t)$') |
|
plt.yscale('log') |
|
plt.axhline(0, color='black') |
|
plt.tight_layout() |
|
plt.show() |