-
-
Save carstenbauer/c482cb14e44246c4186193c50a1f9ac7 to your computer and use it in GitHub Desktop.
| using CUDA | |
| using BenchmarkTools | |
| using Statistics | |
| using UnicodePlots | |
| # bandwidth test | |
| abstract type BytesSIPrefixed end | |
| struct B <: BytesSIPrefixed | |
| value::Int64 | |
| end | |
| struct KB <: BytesSIPrefixed | |
| value::Int64 | |
| end | |
| struct MB <: BytesSIPrefixed | |
| value::Int64 | |
| end | |
| struct GB <: BytesSIPrefixed | |
| value::Int64 | |
| end | |
| _memsize2N(memsize::B; dtype = Float32) = memsize.value ÷ sizeof(dtype) | |
| _memsize2N(memsize::KB; dtype = Float32) = (memsize.value * 1024) ÷ sizeof(dtype) | |
| _memsize2N(memsize::MB; dtype = Float32) = (memsize.value * 1024 * 1024) ÷ sizeof(dtype) | |
| _memsize2N(memsize::GB; dtype = Float32) = (memsize.value * 1024 * 1024 * 1024) ÷ sizeof(dtype) | |
| """ | |
| init_mem(memsize; src = 0, dst = 1, dtype=Float32) | |
| Init memory of size `memsize` on device `src` and `dst`. | |
| """ | |
| function init_mem(memsize::BytesSIPrefixed; src = 0, dst = 1, dtype = Float32) | |
| # src != dst || throw(ArgumentError("src == dst...")) | |
| N = _memsize2N(memsize; dtype) | |
| device!(src) | |
| mem_src = CUDA.rand(N) | |
| device!(dst) | |
| mem_dst = CUDA.zeros(N) | |
| return mem_src, mem_dst | |
| end | |
| init_mem(memsize::Real; kwargs...) = init_mem(B(memsize); kwargs...) | |
| function bench_p2p_copyto!(memsize::BytesSIPrefixed; nbench = 10, verbose = true, hist = true, dtype = Float32, kwargs...) | |
| mem_src, mem_dst = init_mem(memsize; dtype, kwargs...) | |
| actual_memsize = sizeof(mem_src) | |
| ts = zeros(nbench) | |
| @inbounds for i in 1:nbench | |
| ts[i] = CUDA.@elapsed begin | |
| copyto!(mem_dst, mem_src) | |
| end | |
| end | |
| t_min = minimum(ts) | |
| t_max = maximum(ts) | |
| t_avg = mean(ts) | |
| if verbose | |
| println("Memsize: $actual_memsize (requested: $memsize)") | |
| println("t_min: $t_min") | |
| println("t_max: $t_max") | |
| println("t_avg: $t_avg") | |
| actual_memsize_GB = (actual_memsize) / (1024^3) | |
| println("Bandwidth (GB/s):") | |
| println(" ├ max: ", actual_memsize_GB / t_min) | |
| println(" ├ min: ", actual_memsize_GB / t_max) | |
| println(" └ avg: ", actual_memsize_GB / t_avg) | |
| if hist | |
| display(histogram(ts)) | |
| end | |
| end | |
| # return t_min, t_max, t_avg | |
| # return ts | |
| return nothing | |
| end | |
| bench_p2p_copyto!(memsize::Real; kwargs...) = bench_p2p_copyto!(B(memsize); kwargs...) |
Updated benchmark code:
using CUDA
using BenchmarkTools
using Statistics
using UnicodePlots
using Humanize

# bandwidth test
abstract type BytesSIPrefixed end
struct B <: BytesSIPrefixed
    value::Int64
end
struct KB <: BytesSIPrefixed
    value::Int64
end
struct MB <: BytesSIPrefixed
    value::Int64
end
struct GB <: BytesSIPrefixed
    value::Int64
end

_memsize2N(memsize::B; dtype=Float32) = memsize.value ÷ sizeof(dtype)
_memsize2N(memsize::KB; dtype=Float32) = (memsize.value * 1024) ÷ sizeof(dtype)
_memsize2N(memsize::MB; dtype=Float32) = (memsize.value * 1024 * 1024) ÷ sizeof(dtype)
function _memsize2N(memsize::GB; dtype=Float32)
    return (memsize.value * 1024 * 1024 * 1024) ÷ sizeof(dtype)
end

"""
  init_mem(memsize; src = 0, dst = 1, dtype=Float32)
Init memory of size `memsize` (in bytes) on device `src` and `dst`.
"""
function init_mem(memsize::BytesSIPrefixed; src=0, dst=1, dtype=Float32)
    # src != dst || throw(ArgumentError("src == dst..."))
    N = _memsize2N(memsize; dtype)

    device!(src)
    mem_src = CUDA.rand(N)
    device!(dst)
    mem_dst = CUDA.zeros(N)
    return mem_src, mem_dst
end

@inline function time_cuda_elapsed(kernel::F, mem_dst, mem_src) where {F}
    t = CUDA.@elapsed begin
        kernel(mem_dst, mem_src)
    end
    return t
end

@inline function time_cuda_manual(kernel::F, mem_dst, mem_src) where {F}
    start_event = CuEvent(CUDA.CU_EVENT_BLOCKING_SYNC)
    stop_event = CuEvent(CUDA.CU_EVENT_BLOCKING_SYNC)
    stream = CUDA.stream()
    time_ref = Ref{Cfloat}()
    CUDA.cuEventRecord(start_event, stream)

    # actual copyto
    kernel(mem_dst, mem_src)

    CUDA.cuEventRecord(stop_event, stream)
    CUDA.cuEventSynchronize(stop_event)
    CUDA.cuEventElapsedTime(time_ref, start_event, stop_event)
    return time_ref[] / 1000.0
end

@inline function copyto_cuda_direct!(mem_dst, mem_src)
    context!(context(mem_src)) do
        GC.@preserve mem_src mem_dst begin
            stream = CUDA.stream()
            CUDA.cuMemcpyPeerAsync(
                pointer(mem_dst),
                context(device(mem_dst)),
                pointer(mem_src),
                context(device(mem_src)),
                sizeof(mem_src),
                stream,
            )
        end
    end
    return nothing
end

function bench_p2p_copyto!(
    memsize::BytesSIPrefixed=B(40_000_000);
    nbench=5,
    verbose=true,
    hist=false,
    times=false,
    alternate=false,
    kernel::F=copyto!,
    dtype=Float32,
    kwargs...,
) where {F}
    mem_src, mem_dst = init_mem(memsize; dtype, kwargs...)
    actual_memsize = sizeof(mem_src)
    ts = zeros(nbench)

    @inbounds for i in 1:nbench
        if mod(i, alternate ? 2 : 1) == 0
            ts[i] = time_cuda_elapsed(kernel, mem_dst, mem_src)
            # ts[i] = time_cuda_manual(kernel, mem_dst, mem_src)
        else
            ts[i] = time_cuda_elapsed(kernel, mem_src, mem_dst)
            # ts[i] = time_cuda_manual(kernel, mem_src, mem_dst)
        end
    end

    t_min = minimum(ts)
    t_max = maximum(ts)
    t_avg = mean(ts)

    actual_memsize_GB = (actual_memsize) / (1024^3)
    bws = actual_memsize_GB ./ ts
    bw_min = minimum(bws)
    bw_max = maximum(bws)
    bw_avg = mean(bws)

    if verbose
        println("Memsize: $(Humanize.datasize(actual_memsize; style=:gnu))\n")
        if times
            println("t_min: $t_min")
            println("t_max: $t_max")
            println("t_avg: $t_avg")
        end
        printstyled("Bandwidth (GB/s):\n"; bold=true)
        print(" ├ max: ")
        printstyled(round(bw_max; digits=2), "\n"; color=:green, bold=true)
        println(" ├ min: ", round(bw_min; digits=2))
        println(" ├ avg: ", round(bw_avg; digits=2))
        print(" └ std_dev: ")
        printstyled(round(std(bws); digits=2), "\n"; color=:yellow, bold=true)
        if hist
            display(histogram(bws; title="Bandwidths (GB/s)", nbins=5))
        end
    end

    # return t_min, t_max, t_avg
    # return ts
    return nothing
end
Demonstration of some issues
julia> bench_p2p_copyto!(; src=0, dst=1, nbench=5, alternate=false, kernel=copyto!)
Memsize: 38.1M

Bandwidth (GB/s):
 ├ max: 119.52
 ├ min: 108.23
 ├ avg: 116.04
 └ std_dev: 4.5

julia> bench_p2p_copyto!(; src=0, dst=1, nbench=5, alternate=true, kernel=copyto!)
Memsize: 38.1M

Bandwidth (GB/s):
 ├ max: 146.49
 ├ min: 7.19
 ├ avg: 61.52
 └ std_dev: 73.09

julia> bench_p2p_copyto!(; src=0, dst=1, nbench=100, alternate=false, kernel=copyto!)
Memsize: 38.1M

Bandwidth (GB/s):
 ├ max: 154.17
 ├ min: 10.92
 ├ avg: 29.81
 └ std_dev: 43.26

julia> bench_p2p_copyto!(; src=0, dst=1, nbench=100, alternate=true, kernel=copyto!)
Memsize: 38.1M

Bandwidth (GB/s):
 ├ max: 150.68
 ├ min: 3.06
 ├ avg: 76.64
 └ std_dev: 69.87
I'd like to understand why the min and avg bandwidth drops so significantly when we either
- increase
nbench - switch from
alternate=falsetoalternate=true
Here's my results with your new script, for comparison (4x A100, direct NVLink connections):
julia> bench_p2p_copyto!(; src=0, dst=1, nbench=5, alternate=false, kernel=copyto!)
Memsize: 38.1M

Bandwidth (GB/s):
 ├ max: 81.2
 ├ min: 75.32
 ├ avg: 79.18
 └ std_dev: 2.41

julia> bench_p2p_copyto!(; src=0, dst=1, nbench=5, alternate=true, kernel=copyto!)
Memsize: 38.1M

Bandwidth (GB/s):
 ├ max: 146.86
 ├ min: 9.03
 ├ avg: 53.66
 └ std_dev: 63.29

julia> bench_p2p_copyto!(; src=0, dst=1, nbench=100, alternate=false, kernel=copyto!)
Memsize: 38.1M

Bandwidth (GB/s):
 ├ max: 138.33
 ├ min: 6.05
 ├ avg: 23.11
 └ std_dev: 28.24

julia> bench_p2p_copyto!(; src=0, dst=1, nbench=100, alternate=true, kernel=copyto!)
Memsize: 38.1M

Bandwidth (GB/s):
 ├ max: 150.23
 ├ min: 9.75
 ├ avg: 78.57
└ std_dev: 69.34For comparison, results on a pure PCIe-4 (no NVLink) system, 2x NVIDIA A100:
julia> bench_p2p_copyto!(; src=0, dst=1, nbench=5, alternate=false, kernel=copyto!)
Memsize: 38.1M

Bandwidth (GB/s):
 ├ max: 146.1
 ├ min: 135.75
 ├ avg: 138.43
 └ std_dev: 4.36

julia> bench_p2p_copyto!(; src=0, dst=1, nbench=5, alternate=true, kernel=copyto!)
Memsize: 38.1M

Bandwidth (GB/s):
 ├ max: 168.72
 ├ min: 10.8
 ├ avg: 74.11
 └ std_dev: 85.45

julia> bench_p2p_copyto!(; src=0, dst=1, nbench=100, alternate=false, kernel=copyto!)
Memsize: 38.1M

Bandwidth (GB/s):
 ├ max: 176.6
 ├ min: 13.05
 ├ avg: 34.06
 └ std_dev: 50.07

julia> bench_p2p_copyto!(; src=0, dst=1, nbench=100, alternate=true, kernel=copyto!)
Memsize: 38.1M

Bandwidth (GB/s):
 ├ max: 185.14
 ├ min: 10.75
 ├ avg: 95.87
 └ std_dev: 85.02
Average values of nearly 100 GB/s shouldn't be possible with PCIe, though. Confusing ...
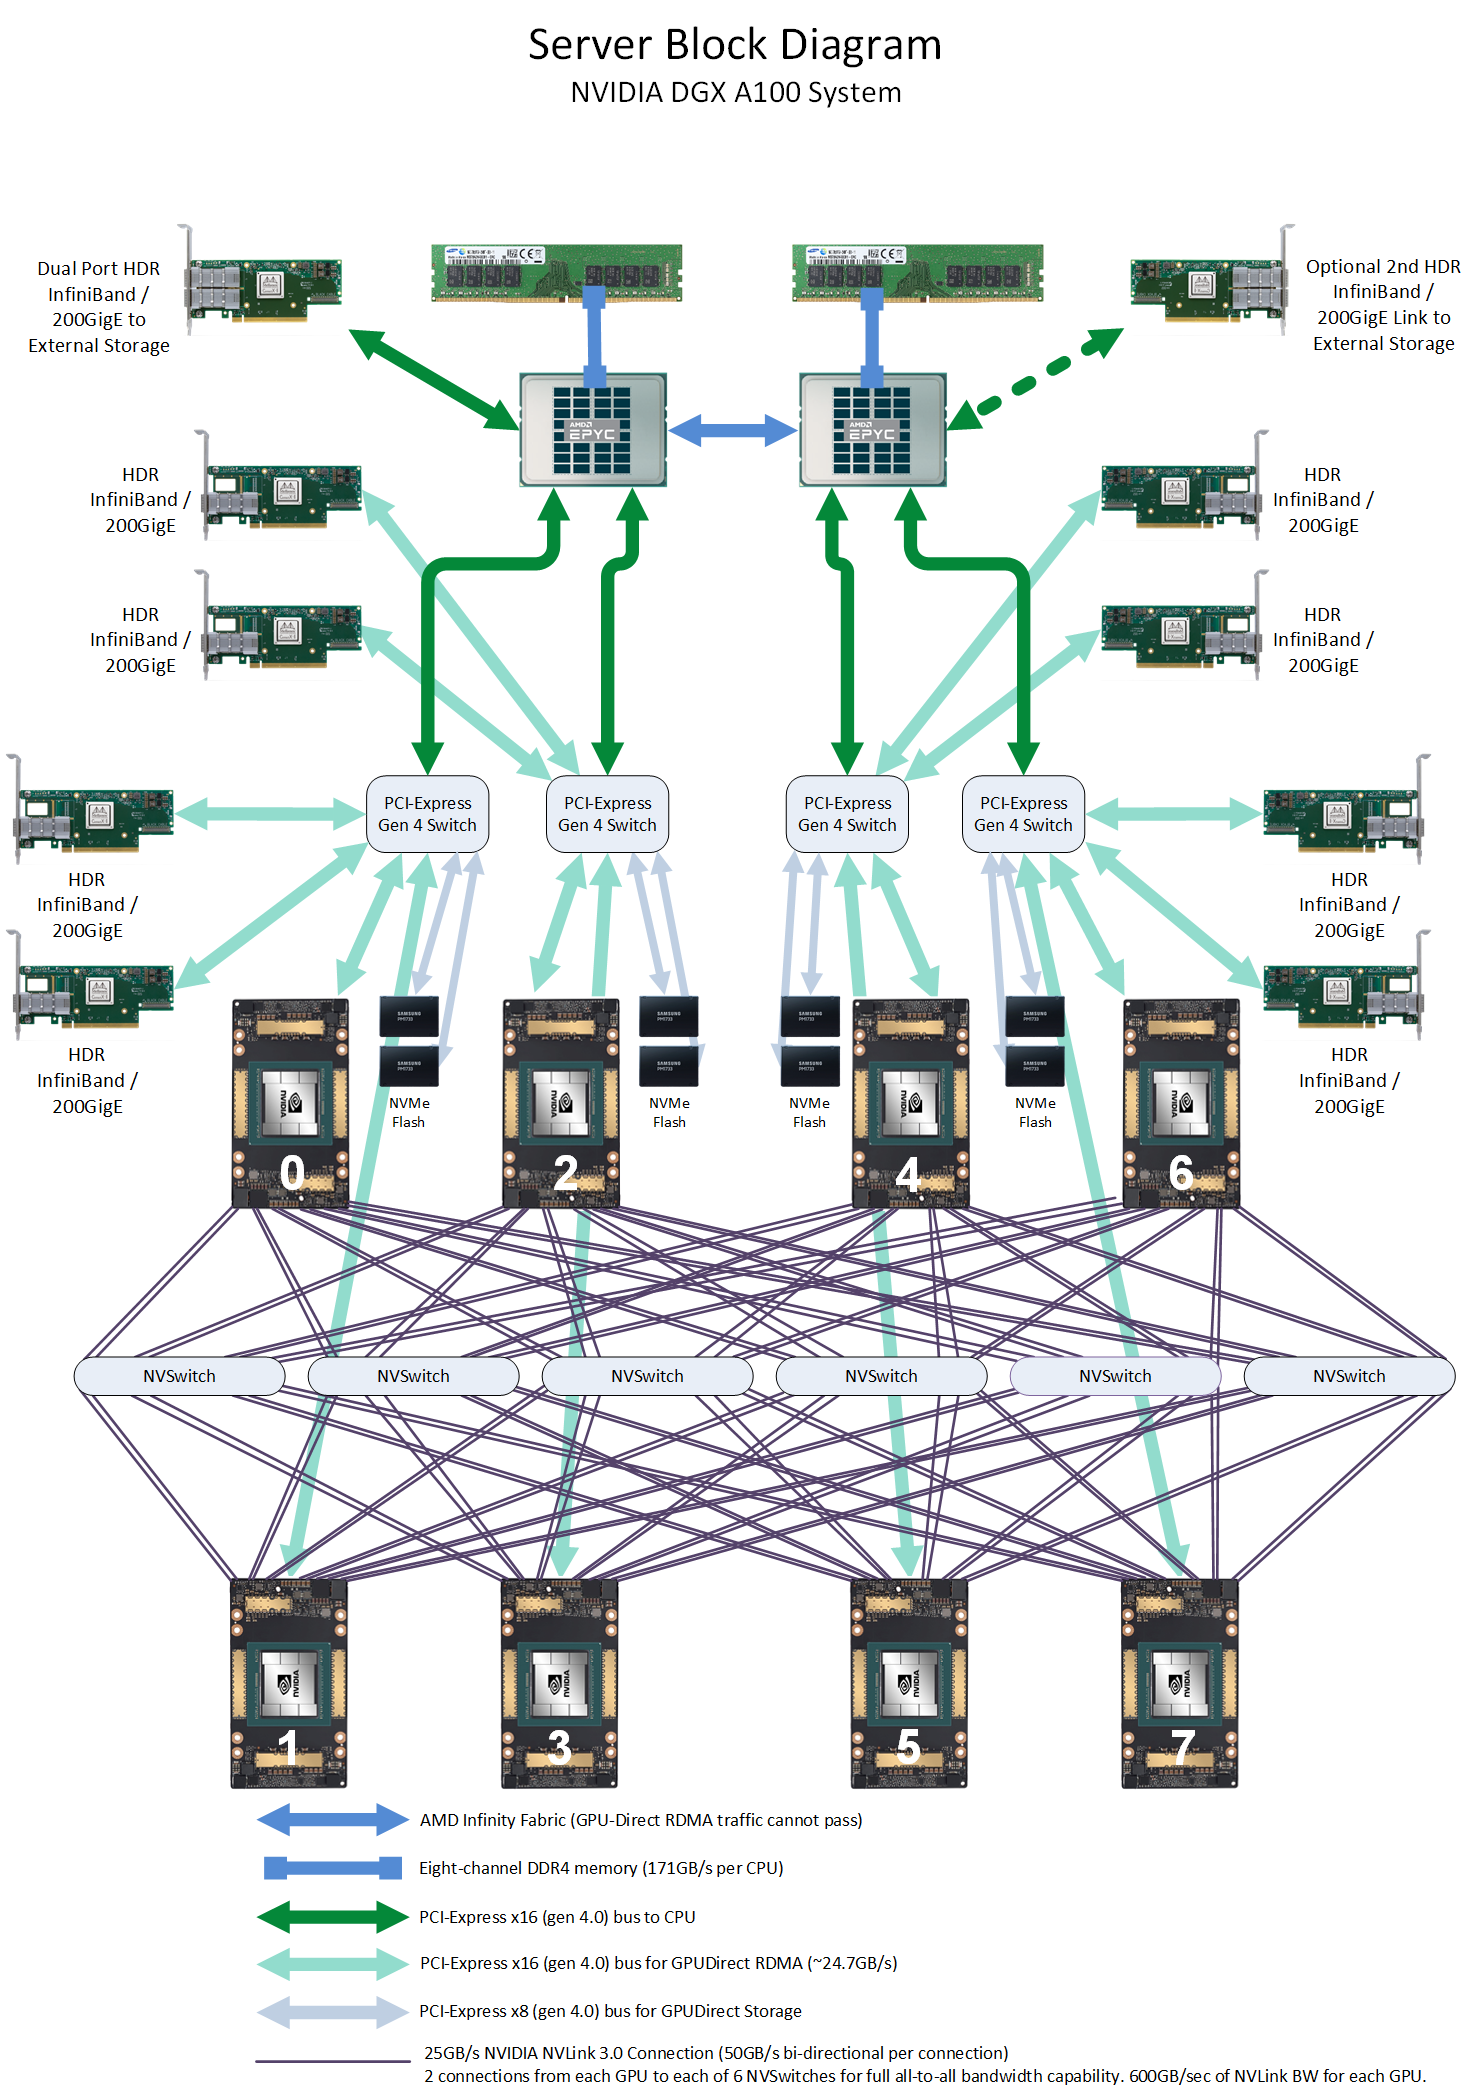
The DGX A100 has NVSwitch. Due to the topology, two GPUs are in principle connected via 12 NVLink connections with 25GB/s unidirectional bandwidth. Therefore, in theory 300GB/s unidirectional could be achieved (if only two GPUs communicate with each other). However, there is of course communication overhead. So our (CUDA C) measured ~230GB/s make sense as well.
@oschulz Yeah, something is really fishy here.
Here some results for a system with 4 V100s:
Julia:
julia> bench_p2p_copyto!(; src=0, dst=1, alternate=true)
Memsize: 38.1M

Bandwidth (GB/s):
 ├ max: 105.04
 ├ min: 5.08
 ├ avg: 40.43
 └ std_dev: 47.51

julia> bench_p2p_copyto!(; src=0, dst=1, alternate=false)
Memsize: 38.1M

Bandwidth (GB/s):
 ├ max: 72.76
 ├ min: 66.15
 ├ avg: 70.24
 └ std_dev: 3.11
CUDA C:
➜  cbauer@v01 comparison git:(master)  cat p2p_test.out
[./p2p_test] - Starting...
Checking for multiple GPUs...
CUDA-capable device count: 4

Checking GPU(s) for support of peer to peer memory access...
> Peer access from Tesla V100-SXM2-32GB (GPU0) -> Tesla V100-SXM2-32GB (GPU1) : Yes
> Peer access from Tesla V100-SXM2-32GB (GPU0) -> Tesla V100-SXM2-32GB (GPU2) : Yes
> Peer access from Tesla V100-SXM2-32GB (GPU0) -> Tesla V100-SXM2-32GB (GPU3) : Yes
> Peer access from Tesla V100-SXM2-32GB (GPU1) -> Tesla V100-SXM2-32GB (GPU0) : Yes
> Peer access from Tesla V100-SXM2-32GB (GPU1) -> Tesla V100-SXM2-32GB (GPU2) : Yes
> Peer access from Tesla V100-SXM2-32GB (GPU1) -> Tesla V100-SXM2-32GB (GPU3) : Yes
> Peer access from Tesla V100-SXM2-32GB (GPU2) -> Tesla V100-SXM2-32GB (GPU0) : Yes
> Peer access from Tesla V100-SXM2-32GB (GPU2) -> Tesla V100-SXM2-32GB (GPU1) : Yes
> Peer access from Tesla V100-SXM2-32GB (GPU2) -> Tesla V100-SXM2-32GB (GPU3) : Yes
> Peer access from Tesla V100-SXM2-32GB (GPU3) -> Tesla V100-SXM2-32GB (GPU0) : Yes
> Peer access from Tesla V100-SXM2-32GB (GPU3) -> Tesla V100-SXM2-32GB (GPU1) : Yes
> Peer access from Tesla V100-SXM2-32GB (GPU3) -> Tesla V100-SXM2-32GB (GPU2) : Yes
Enabling peer access between GPU0 and GPU1...
Allocating buffers (38MB on GPU0 and GPU1 )...
Creating event handles...
cudaMemcpyPeer / cudaMemcpy between GPU0 and GPU1: 22.44GB/s
Disabling peer access...
Shutting down...
The CUDA C result seems to make sense. The Julia result not at all?!
Note to future self: Maybe I should profile things similar to https://stackoverflow.com/questions/18323896/cuda-timing-for-multi-gpu-applications?noredirect=1&lq=1.
CUDA.@profile bench_p2p_copyto!(; src=0, dst=1, nbench=4, alternate=false, kernel=copyto!) - p2p1.qdrep:
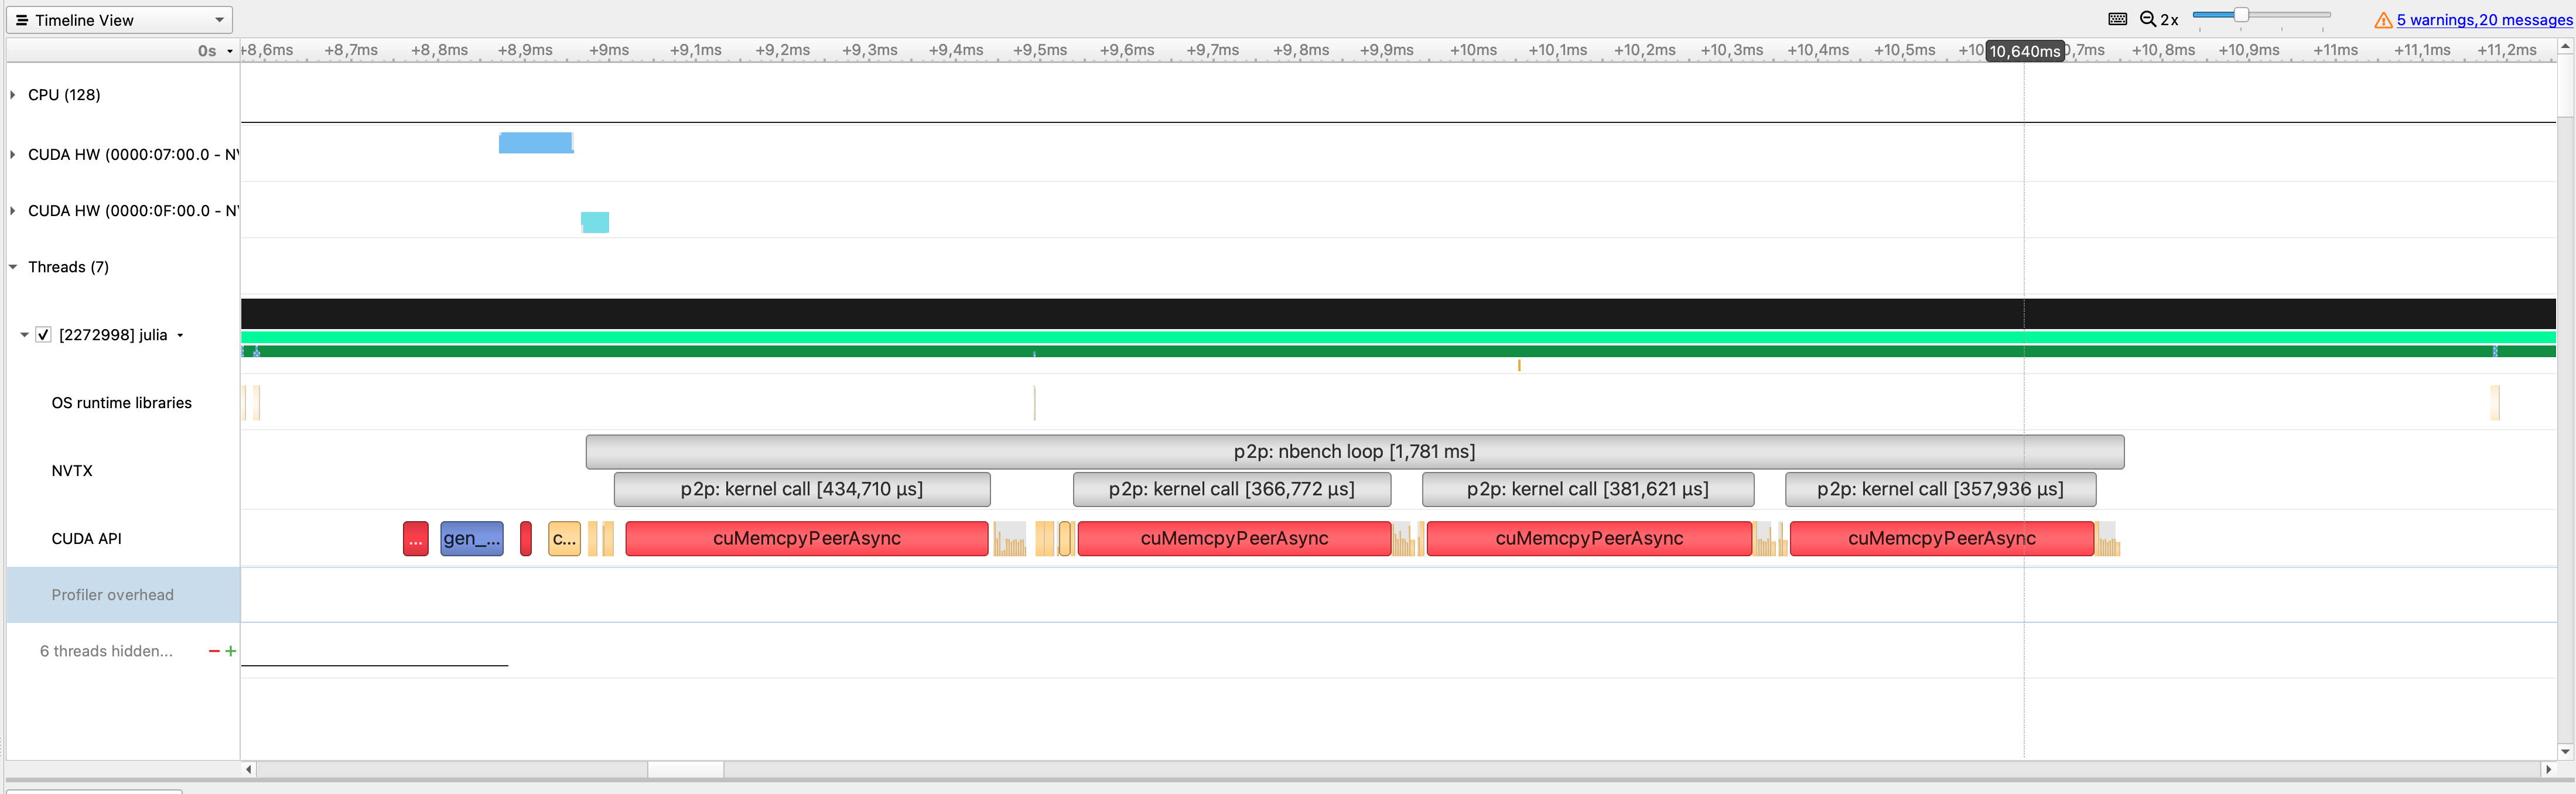
CUDA.@profile bench_p2p_copyto!(; src=0, dst=1, nbench=4, alternate=true, kernel=copyto!) - p2p2.qdrep:

CUDA.@profile bench_p2p_copyto!(; src=0, dst=1, nbench=100, alternate=false, kernel=copyto!) - p2p3.qdrep:

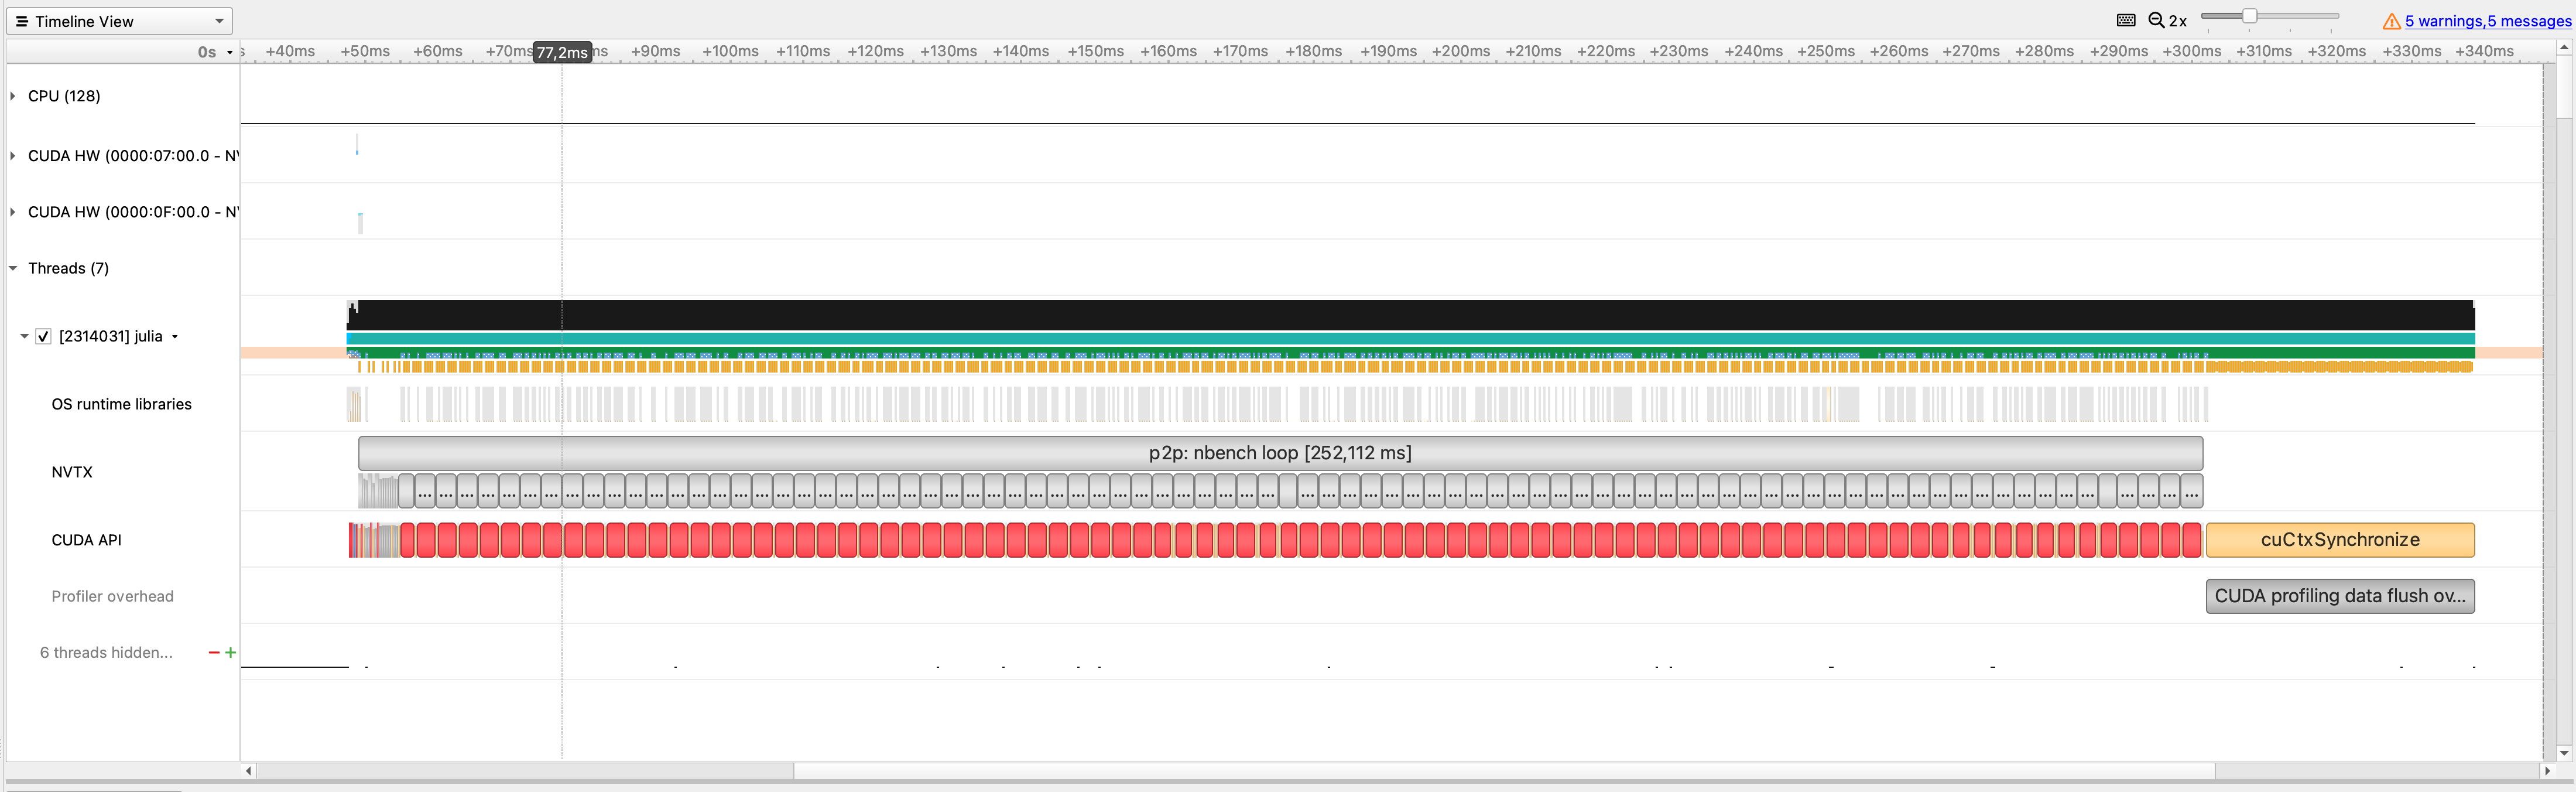
Note that in the nbench=100 case the duration of the cuMemcpyPeerAsync calls seem to jump from "fast" to "slow" after a few calls.
Can you try collecting GPU metrics? The easiest way to do so is to let NSight Systems launch Julia, and check the "Collect GPU metrics" box (ideally with the script doing a warm-up iteration, and starting the profiler manually). I can't verify, but there should be something on NVLink given that there exist nvlink_receive_throughput (and other) metrics.
Here is a reference profile for the CUDA C example on the DGX A100 (nbench is set to 4).
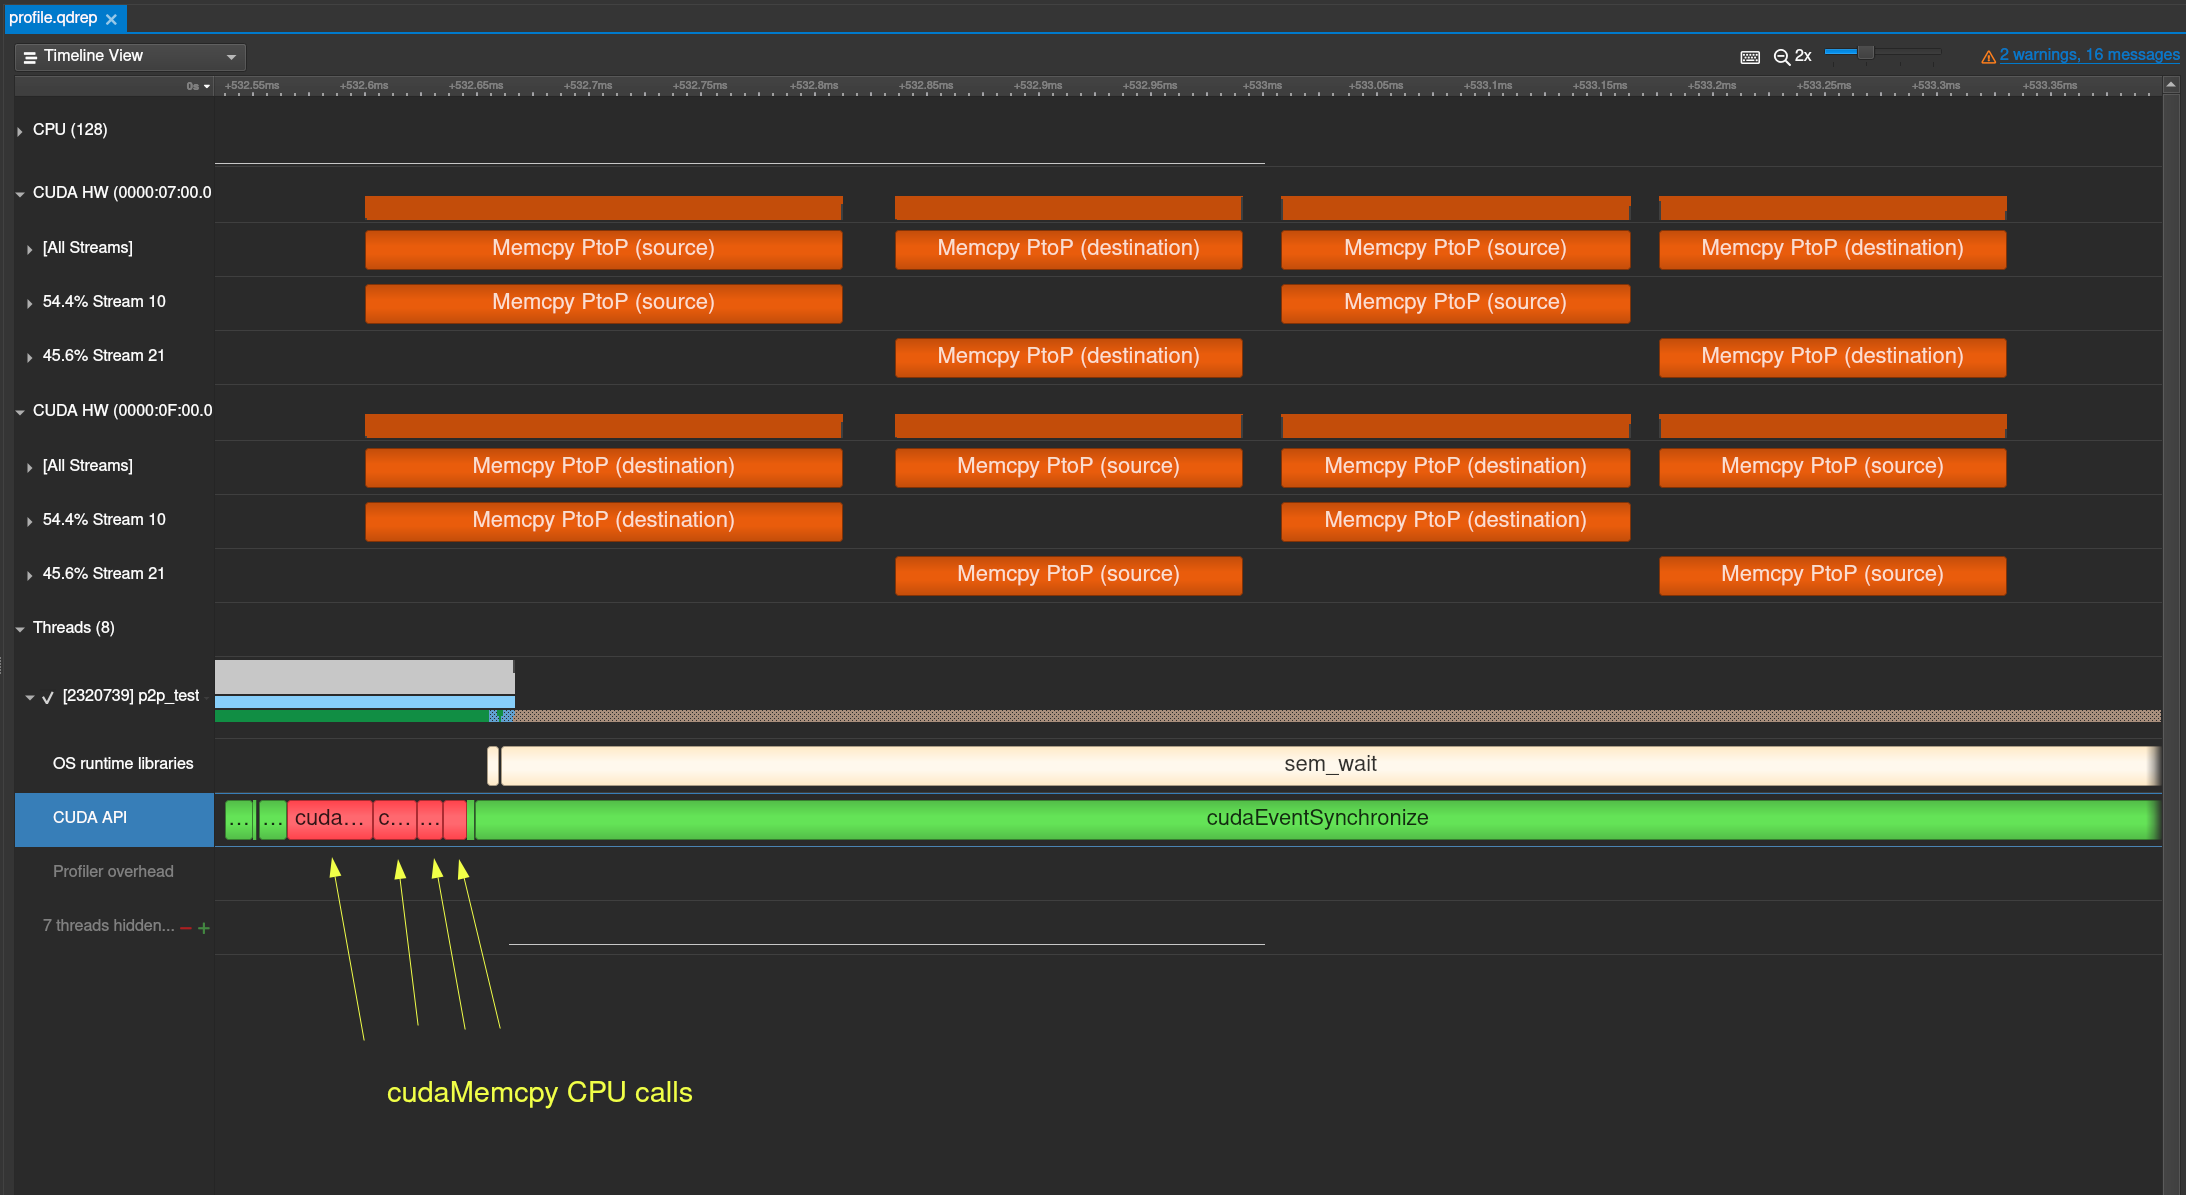
You can find the profile here
@carstenbauer Are there no "Memcpy PtoP" blocks visible in the "CUDA HW" categories?
Are there no "Memcpy P2P" blocks visible in the "CUDA HW" categories?
Not that I could see. @maleadt, can I somehow get this (in particular the stream information that @lukas-mazur gets for the CUDA C benchmark)?
Can you try collecting GPU metrics? The easiest way to do so is to let NSight Systems launch Julia, and check the "Collect GPU metrics" box (ideally with the script doing a warm-up iteration, and starting the profiler manually). I can't verify, but there should be something on NVLink given that there exist
nvlink_receive_throughput(and other) metrics.
I'm analyzing the report on my macbook while the profiling happens on the DGX (integrated in a cluster environment). So I can't easily launch Julia through Nsight Systems and check a box. Can I make nsys collect GPU metrics via the CLI tool?
I'm analyzing the report on my macbook while the profiling happens on the DGX (integrated in a cluster environment). So I can't easily launch Julia through Nsight Systems and check a box. Can I make
nsyscollect GPU metrics via the CLI tool?
Yes, use nsys profile --gpu-metrics-device=all (this isn't supported by nsys launch IIUC)
@maleadt There you go. My (noobish) observations are
- NVLink Bandwidth seems to be quiet (zero) for all GPUs(?)
- PCIe Bandwidth is finite on GPU 0 (0000:07:00.0) but for no other GPU?! - I guess this makes sense as we're only copy unidirectionally.
- Why is the (first) NVTX region
p2p: kernel callso wide (i.e. takes so long) compared to the following ones? (thecuMemcpyPeerAsynccall is at the very end of that region) - OK, this seems to be compilation. There is a second run for which things are more "compact".
nsys profile --gpu-metrics-device=all --wait=primary julia --project intergpu_copy.jl - p2p1_metrics.qdrep
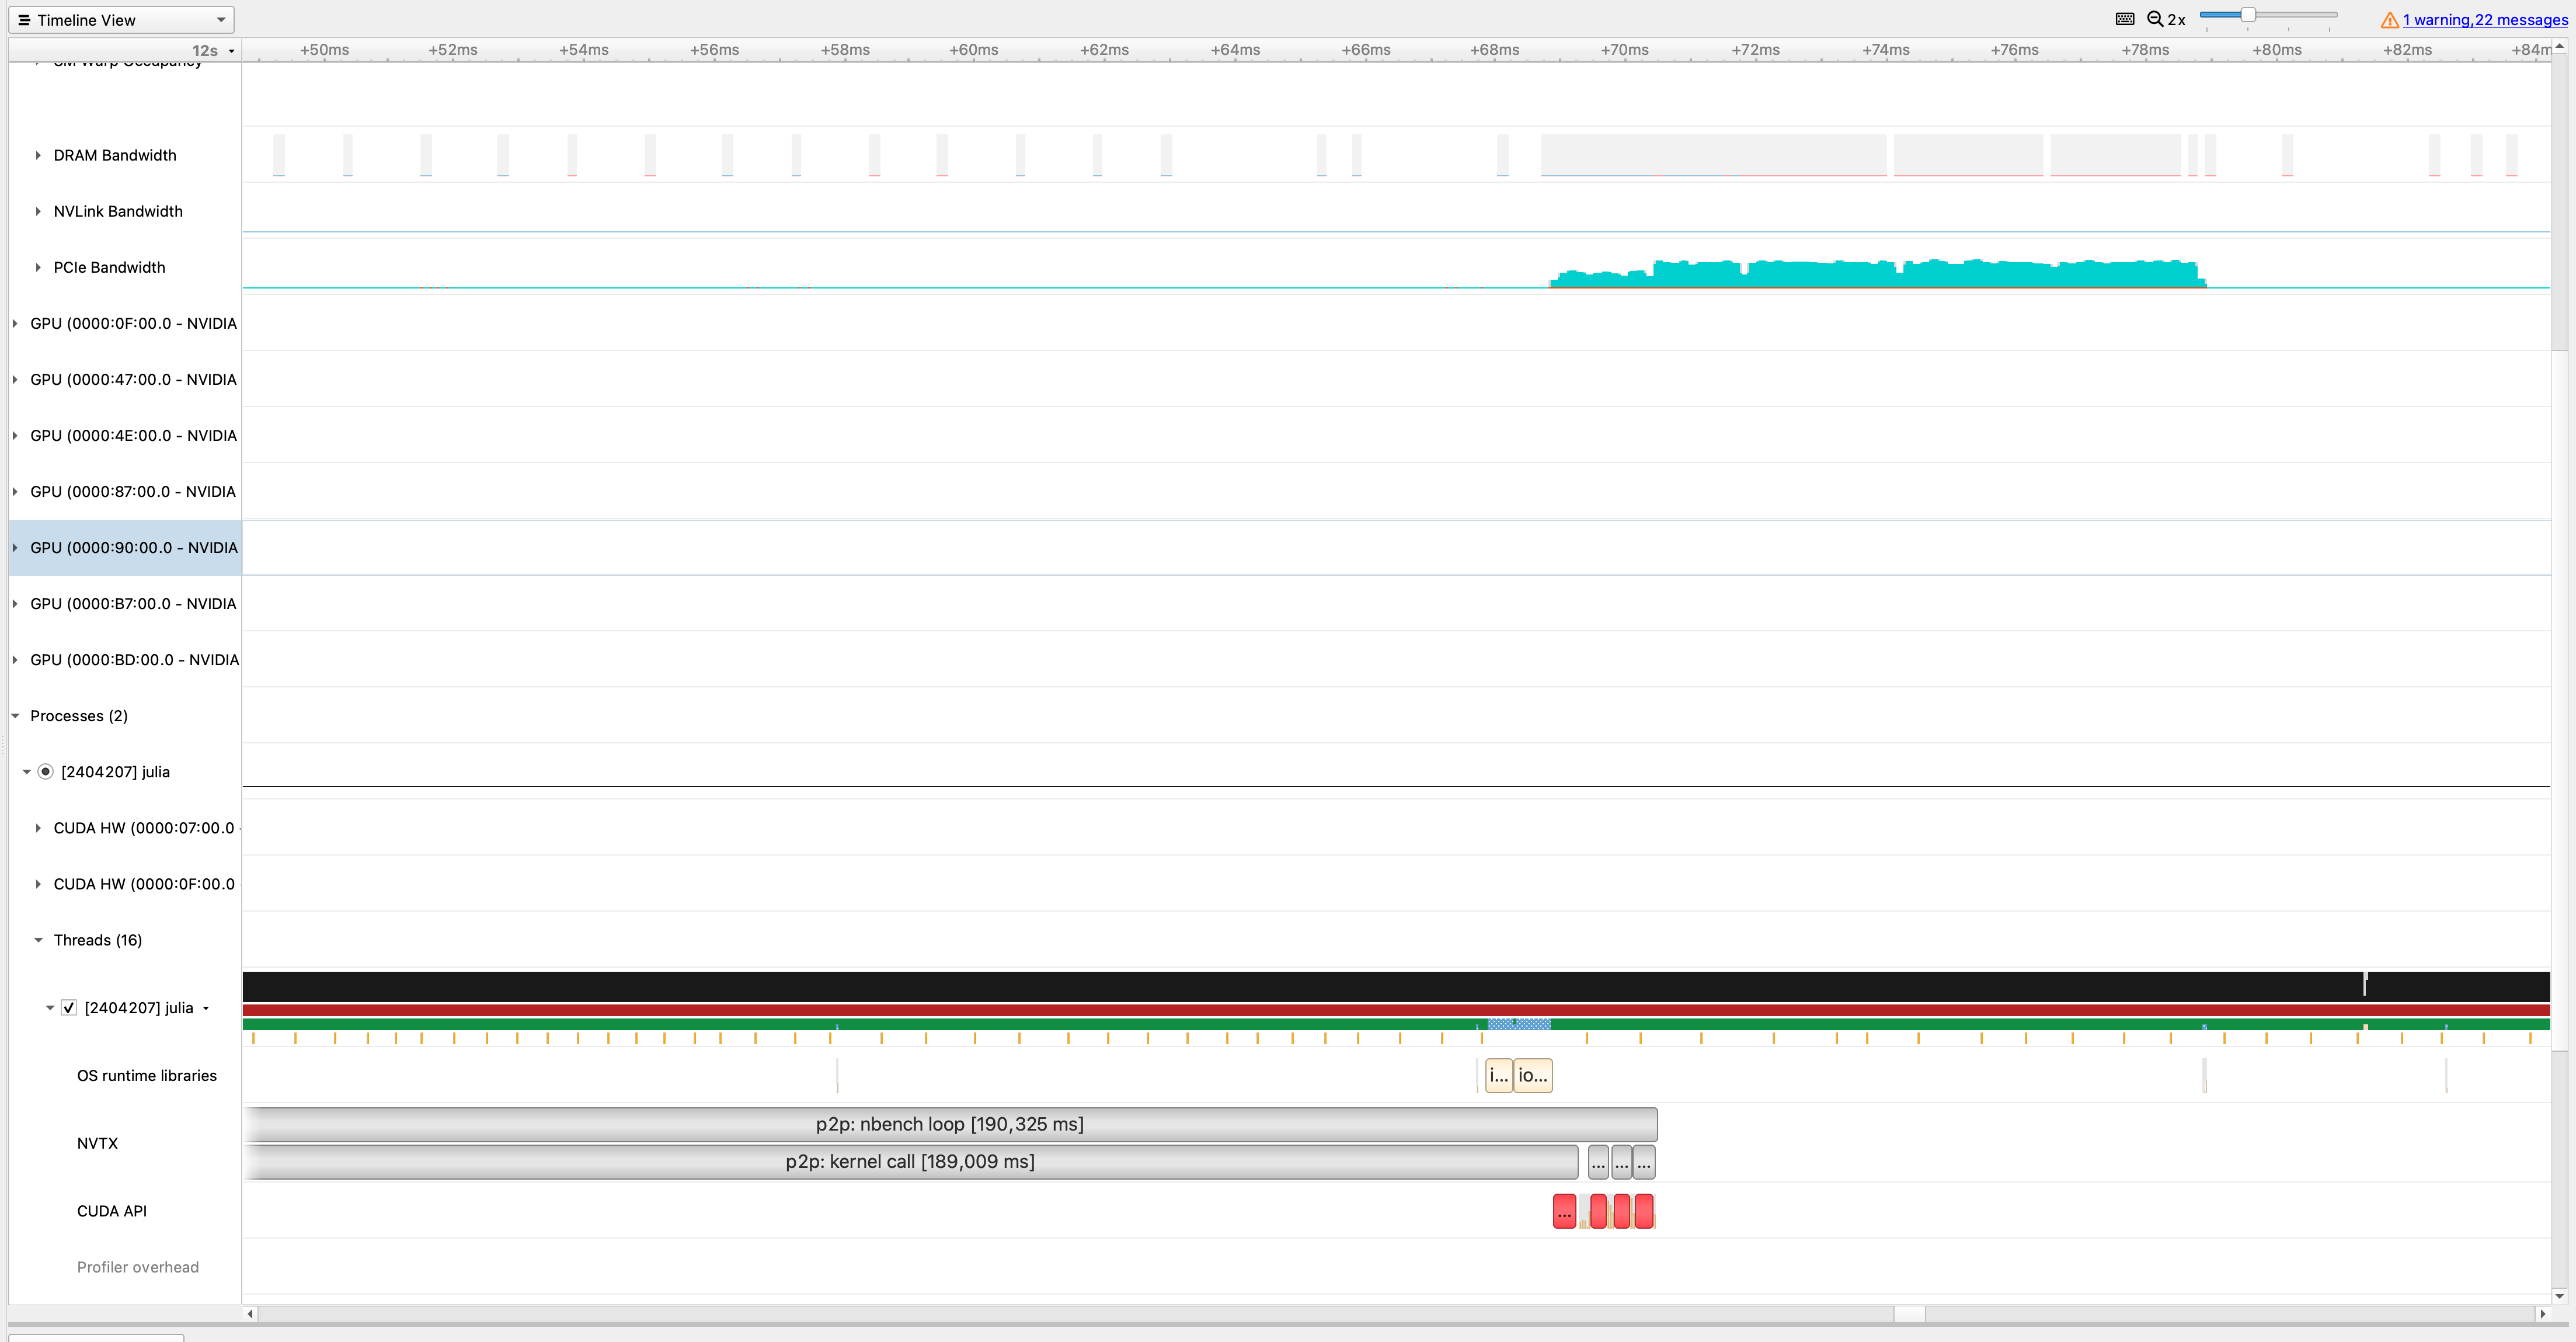
@maleadt: Apart from potential benchmarking mistakes (on my side?), it seems like NVLink isn't used.
Are there no "Memcpy P2P" blocks visible in the "CUDA HW" categories?
Not that I could see. @maleadt, can I somehow get this (in particular the stream information that @lukas-mazur gets for the CUDA C benchmark)?
I'm not sure how to get those, and lacking the hardware I can't experiment. @lukas-mazur which version of NSight Systems are you using?
It seems like CUDA.jl-based benchmarks just don't use NVLink. I'm not sure why, AFAIK I'm using the correct API calls (check and enable P2P support, use cuMemcpyPeer). Maybe we're setting-up the stream or context incorrectly, or in a way that doesn't support NVLink? We generally don't do anything exotic though, so I don't have any immediate ideas what would be the culprit.
@maleadt The version of NSight System I was using is 2021.3.3.2-b99c4d6.
However, I don't think it's a problem of NSight Systems, since @carstenbauer and me were profiling on the same machine.
I also think that Julia is somehow not using NVLink.
@maleadt That CUDA.jl isn't using NVLink is one issue (and I also don't currently see why it doesn't). However, there seems to be (at least) one other issue since even if PCIe is used I wouldn't expect the issues listed above (strange dependence of results on nbench and alternate as well as @oschulz's unreasonable benchmark results for a pure PCIe-4 system without NVLink).
It's related to the stream-ordered memory allocator. Using the old allocator 'fixes' the issue (try setting JULIA_CUDA_MEMORY_POOL=none before importing CUDA.jl). I'm looking into fixing this properly, we probably need to configure (or use a custom) memory pool.
Driver-API MWE:
#include <stdlib.h>
#include <stdio.h>
#include <cuda.h>

void _check(CUresult status, char const *const func, const char *const file,
            int const line) {
    if (status != CUDA_SUCCESS) {
        const char *perrstr = 0;
        CUresult ok = cuGetErrorString(status, &perrstr);
        if (ok == CUDA_SUCCESS && perrstr) {
            fprintf(stderr, "CUDA error at %s:%d code=%d(%s) \"%s\" \n", file, line,
                    status, perrstr, func);
        } else {
            fprintf(stderr, "CUDA error at %s:%d code=%d\n", file, line,
                    status);
        }
        exit(EXIT_FAILURE);
    }
}
#define check(val) _check((val), #val, __FILE__, __LINE__)

//#define ASYNC

int main(int argc, char **argv)
{
    check(cuInit(0));

    CUdevice gpu0, gpu1;
    check(cuDeviceGet(&gpu0, 0));
    check(cuDeviceGet(&gpu1, 1));

    CUcontext ctx0, ctx1;
    check(cuCtxCreate(&ctx0, 0, gpu0));
    check(cuCtxCreate(&ctx1, 0, gpu1));

    check(cuCtxSetCurrent(ctx0));
    check(cuCtxEnablePeerAccess(ctx1, 0));
    check(cuCtxSetCurrent(ctx1));
    check(cuCtxEnablePeerAccess(ctx0, 0));

#ifdef ASYNC
    CUstream stream0, stream1;
    check(cuCtxSetCurrent(ctx0));
    check(cuStreamCreate(&stream0, 0));
    check(cuCtxSetCurrent(ctx1));
    check(cuStreamCreate(&stream1, 0));
#endif

    const size_t buf_size = 40000000;

    check(cuCtxSetCurrent(ctx0));
    CUdeviceptr buf0;
#ifdef ASYNC
    check(cuMemAllocAsync(&buf0, buf_size, stream0));
    check(cuStreamSynchronize(stream0));
#else
    check(cuMemAlloc(&buf0, buf_size));
#endif
    check(cuCtxSetCurrent(ctx1));
    CUdeviceptr buf1;
#ifdef ASYNC
    check(cuMemAllocAsync(&buf1, buf_size, stream1));
    check(cuStreamSynchronize(stream1));
#else
    check(cuMemAlloc(&buf1, buf_size));
#endif

    check(cuCtxSetCurrent(ctx0));
    check(cuMemcpyPeer(buf1, ctx1, buf0, ctx0, buf_size));
    check(cuCtxSynchronize());
}
$ nsys profile -o driver_test.nsys-rep ./driver_test
$ nsys stats -r gpumemtimesum driver_test.nsys-rep
Time (%) Total Time (ns) Count Avg (ns) Med (ns) Min (ns) Max (ns) StdDev (ns) Operation
-------- --------------- ----- --------- --------- -------- -------- ----------- ------------------
100.0 480,348 1 480,348.0 480,348.0 480,348 480,348 0.0 [CUDA memcpy PtoP]
That PtoP entry disappears when defining ASYNC in the MWE.
Proper fix in JuliaGPU/CUDA.jl#1357.
EDIT: removed numbers that didn't make sense.
Well, the numbers are higher, so that's great 😄 Unfortunately, they don't seem to make any sense. I'll profile this later to, hopefully, understand what's going on.
BTW, this is what I get on our DGX with JuliaGPU/CUDA.jl#1357 checked out:
julia> bench_p2p_copyto!(; src=0, dst=1, nbench=100, alternate=false, kernel=copyto!)
Memsize: 38.1M

Bandwidth (GB/s):
├ max: 9094.95
├ min: 3307.25
├ avg: 6478.52
└ std_dev: 847.61Well, the numbers are higher, so that's great smile Unfortunately, they don't seem to make any sense.
Maybe not, but I confirmed that the resulting bandwidth in NSight is as expected: around 80GB/s, the same as I measured with the CUDA C benchmark. (I just focused on replicating the behavior of the C example on this given system.)
Yay!
Maybe not, but I confirmed that the resulting bandwidth in NSight is as expected: around 80GB/s.
I would expect the bandwidth in NSight to be similar to the one which @carstenbauer code is printing out. Could it be that there is something wrong with the synchronization call in CUDA.jl @maleadt ?
Could it be that there is something wrong with the synchronization call in CUDA.jl @maleadt ?
The problem is that copying between devices involves multiple contexts and streams. Normally you only work with a single device, involving a single context and stream, so calls like CUDA.@elapsed operate on the current stream. However, that isn't necessarily correct when copying between devices, but it also doesn't make sense to have these calls synchronize all devices instead.
So what I'm saying is that the benchmark code needs fixing:
@inline function time_cuda_elapsed(kernel::F, mem_dst, mem_src) where {F}
    CUDA.context!(context(mem_src)) do
        CUDA.@elapsed begin
            kernel(mem_dst, mem_src)
        end
    end
end
That consistently reports 80GB/s as measured in NSight Systems. Maybe we can do better with the APIs exposed by CUDA.jl, but as I explained above that isn't easy when involving multiple devices.
You could spot this in the profile: the API calls part of CUDA.@elapsed ought to wait for the GPU to finish, or obviously the measurement wouldn't make any sense. This didn't happen:

Executing CUDA.@elapsed in the correct context results in:
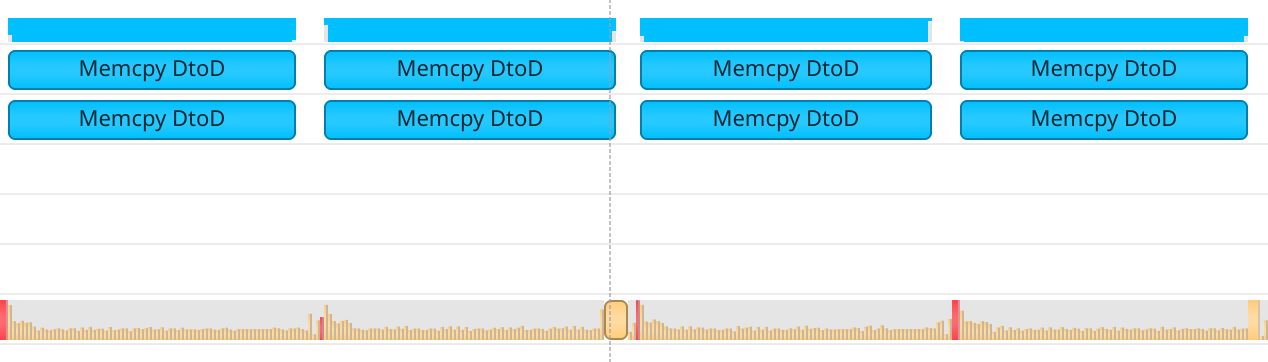
(it's possible this didn't happen before my fixes of the stream-ordered allocator, as the invocation of cuMemcpyPeer might have behaved synchronously then. but it seems to fix the alternative mode here.)
Thanks @maleadt, that makes a ton of sense! With CUDA.jl#master and performing the time measurement in the context of mem_src as suggested seems to fix all the issues!
Code:
using CUDA
using BenchmarkTools
using Statistics
using UnicodePlots
using Humanize

abstract type BytesSIPrefixed end
struct B <: BytesSIPrefixed
    value::Int64
end
struct KB <: BytesSIPrefixed
    value::Int64
end
struct MB <: BytesSIPrefixed
    value::Int64
end
struct GB <: BytesSIPrefixed
    value::Int64
end

_memsize2N(memsize::B; dtype=Float32) = memsize.value ÷ sizeof(dtype)
_memsize2N(memsize::KB; dtype=Float32) = (memsize.value * 2^10) ÷ sizeof(dtype)
_memsize2N(memsize::MB; dtype=Float32) = (memsize.value * 2^20) ÷ sizeof(dtype)
_memsize2N(memsize::GB; dtype=Float32) = (memsize.value * 2^30) ÷ sizeof(dtype)

"""
    init_mem(memsize::BytesSIPrefixed; src = 0, dst = 1, dtype=Float32)
Init memory on devices `src` and `dst`.

**Examples:**
```julia
init_mem(MB(1024))
init_mem(B(40_000_000))
```
"""
function init_mem(memsize::BytesSIPrefixed; src=0, dst=1, dtype=Float32)
    # src != dst || throw(ArgumentError("src == dst..."))
    N = _memsize2N(memsize; dtype)

    device!(src)
    mem_src = CUDA.rand(N)
    device!(dst)
    mem_dst = CUDA.zeros(N)
    return mem_src, mem_dst
end

@inline function _time_cuda_elapsed(kernel::F, mem_dst, mem_src) where {F}
    t = CUDA.context!(context(mem_src)) do
            CUDA.@elapsed begin
                NVTX.@range "p2p: kernel call" begin
                    kernel(mem_dst, mem_src)
                end
            end
    end
    return t
end

"""
    bench_p2p_memcpy([memsize::BytesSIPrefixed]; kwargs...)

Performs a peer-to-peer memory copy benchmark (time measurement) and
returns an inter-gpu memory bandwidth estimate (in GB/s) derived from it.

**Keyword arguments:**
* `src` (default: `0`): source device
* `dst` (default: `1`): destination device
* `nbench` (default: `5`): number of time measurements (i.e. p2p memcopies)
* `verbose` (default: `true`): set to false to turn off any printing.
* `hist` (default: `false`): when `true`, a UnicodePlots-based histogram is printed.
* `times` (default: `false`): toggle printing of measured times.
* `alternate` (default: `false`): alternate `src` and `dst`, i.e. copy data back and forth.
* `dtype` (default: `Float32`): see [`init_mem`](@ref).

**Examples:**
```julia
bench_p2p_memcpy()
bench_p2p_memcpy(MB(1024))
bench_p2p_memcpy(KB(20_000); dtype=Int32)
```
"""
function bench_p2p_memcpy(
    memsize::BytesSIPrefixed=B(40_000_000);
    nbench=5,
    verbose=true,
    hist=false,
    times=false,
    alternate=false,
    dtype=Float32,
    kwargs...,
)
    mem_src, mem_dst = init_mem(memsize; dtype, kwargs...)
    actual_memsize = sizeof(mem_src)
    ts = zeros(nbench)

    NVTX.@range "p2p: nbench loop" begin
        @inbounds for i in 1:nbench
            if mod(i, alternate ? 2 : 1) == 0
                ts[i] = _time_cuda_elapsed(copyto!, mem_dst, mem_src)
            else
                ts[i] = _time_cuda_elapsed(copyto!, mem_src, mem_dst)
            end
        end
    end

    t_min = minimum(ts)
    t_max = maximum(ts)
    t_avg = mean(ts)

    actual_memsize_GB = (actual_memsize) / (1024^3)
    bws = actual_memsize_GB ./ ts
    bw_min = minimum(bws)
    bw_max = maximum(bws)
    bw_avg = mean(bws)

    if verbose
        println("Memsize: $(Humanize.datasize(actual_memsize; style=:gnu))\n")
        if times
            println("t_min: $t_min")
            println("t_max: $t_max")
            println("t_avg: $t_avg")
        end
        printstyled("Bandwidth (GB/s):\n"; bold=true)
        print(" ├ max: ")
        printstyled(round(bw_max; digits=2), "\n"; color=:green, bold=true)
        println(" ├ min: ", round(bw_min; digits=2))
        println(" ├ avg: ", round(bw_avg; digits=2))
        print(" └ std_dev: ")
        printstyled(round(std(bws); digits=2), "\n"; color=:yellow, bold=true)
        if hist
            display(histogram(bws; title="Bandwidths (GB/s)", nbins=5))
        end
    end

    return bw_max
end

"""
    bench_p2p_memcpy_all(args...; kwargs...)

Run [`bench_p2p_memcpy`](@ref) for all combinations of devices.
Returns a matrix with the p2p memory bandwidth estimates.
"""
function bench_p2p_memcpy_all(args...; kwargs...)
    ngpus = length(CUDA.devices())
    return [src == dst ? nothing : bench_p2p_memcpy(args...; src=src, dst=dst, verbose=false, kwargs...) for src in 0:ngpus-1, dst in 0:ngpus-1]
end
For our A100s in the DGX (i.e. with NVSwitch) I now get:
julia> bench_p2p_memcpy();
Memsize: 38.1M

Bandwidth (GB/s):
 ├ max: 247.32
 ├ min: 173.5
 ├ avg: 229.63
 └ std_dev: 31.67

julia> bench_p2p_memcpy_all()
8×8 Matrix{Union{Nothing, Float64}}:
    nothing  245.706     241.075     244.467     246.434     242.229     245.085     245.033
 239.046        nothing  241.776     243.853     241.626     245.136     244.467     240.379
 246.957     242.633        nothing  242.937     245.291     248.114     239.193     242.684
 244.724     241.375     244.211        nothing  245.861     238.117     245.085     242.28
 241.576     246.329     242.582     245.602        nothing  246.59      240.677     243.343
 247.114     240.18      245.965     244.006     236.616        nothing  242.28      244.673
 243.802     242.028     248.326     239.933     244.365     245.033        nothing  245.498
 245.136     246.904     239.488     243.343     244.057     240.627     243.445        nothing
which agrees well with the C Code by @lukas-mazur. I guess the numbers are also reasonable given a theoretical maximum of 25GB/s * 12 = 300GB/s.
FWIW, this is the profile:

That's great!
I'm willing to investigate this further (hopefully) in the next few days. My next step would be to essential 1-to-1 translate @lukas-mazur's C example (i.e. not use Julia + CUDA.jl's high-level functionality but try to call the same CUDA functions. In fact, I've already started with it but noticed that the C code calls into the runtime API whereas CUDA.jl seems to mostly use the driver API. For example, there doesn't seem to be a wrapper for
cudaMemcpyavailable as of now. Not sure whether I should extend the runtime API wrapper or try to figure out how to replace these calls with "driver API equivalents".In any case, @maleadt it would be great if you could take a look at what we've gathered so far above and comment on what you think could be an issue / what I should test. Thanks you in advance!