Last active
August 22, 2020 19:17
-
-
Save chanjarster/9e164df1461501ebfd7bc4c66d281a7f to your computer and use it in GitHub Desktop.
Grafana dashboard - tomcat dashboard
This file contains bidirectional Unicode text that may be interpreted or compiled differently than what appears below. To review, open the file in an editor that reveals hidden Unicode characters.
Learn more about bidirectional Unicode characters
| { | |
| "__inputs": [ | |
| { | |
| "name": "VAR_JOB", | |
| "type": "constant", | |
| "label": "Job", | |
| "value": "java", | |
| "description": "" | |
| } | |
| ], | |
| "__requires": [ | |
| { | |
| "type": "grafana", | |
| "id": "grafana", | |
| "name": "Grafana", | |
| "version": "5.4.2" | |
| }, | |
| { | |
| "type": "panel", | |
| "id": "graph", | |
| "name": "Graph", | |
| "version": "5.0.0" | |
| }, | |
| { | |
| "type": "datasource", | |
| "id": "prometheus", | |
| "name": "Prometheus", | |
| "version": "5.0.0" | |
| }, | |
| { | |
| "type": "panel", | |
| "id": "singlestat", | |
| "name": "Singlestat", | |
| "version": "5.0.0" | |
| } | |
| ], | |
| "annotations": { | |
| "list": [ | |
| { | |
| "builtIn": 1, | |
| "datasource": "-- Grafana --", | |
| "enable": true, | |
| "hide": true, | |
| "iconColor": "rgba(0, 211, 255, 1)", | |
| "name": "Annotations & Alerts", | |
| "type": "dashboard" | |
| } | |
| ] | |
| }, | |
| "description": "Tomcat dashboard using metrics from prometheus JMX exporter, with drill down per job > instance", | |
| "editable": true, | |
| "gnetId": 8704, | |
| "graphTooltip": 0, | |
| "id": null, | |
| "iteration": 1545278710138, | |
| "links": [], | |
| "panels": [ | |
| { | |
| "cacheTimeout": null, | |
| "colorBackground": false, | |
| "colorValue": false, | |
| "colors": [ | |
| "#299c46", | |
| "rgba(237, 129, 40, 0.89)", | |
| "#d44a3a" | |
| ], | |
| "datasource": "$datasource", | |
| "format": "none", | |
| "gauge": { | |
| "maxValue": 100, | |
| "minValue": 0, | |
| "show": false, | |
| "thresholdLabels": false, | |
| "thresholdMarkers": true | |
| }, | |
| "gridPos": { | |
| "h": 4, | |
| "w": 24, | |
| "x": 0, | |
| "y": 0 | |
| }, | |
| "id": 27, | |
| "interval": null, | |
| "links": [ | |
| { | |
| "dashboard": "JVM dashboard", | |
| "includeVars": true, | |
| "keepTime": true, | |
| "targetBlank": true, | |
| "title": "JVM dashboard", | |
| "type": "dashboard", | |
| "url": "/d/chanjarster-jvm-dashboard/jvm-dashboard" | |
| } | |
| ], | |
| "mappingType": 1, | |
| "mappingTypes": [ | |
| { | |
| "name": "value to text", | |
| "value": 1 | |
| }, | |
| { | |
| "name": "range to text", | |
| "value": 2 | |
| } | |
| ], | |
| "maxDataPoints": 100, | |
| "nullPointMode": "connected", | |
| "nullText": null, | |
| "postfix": "", | |
| "postfixFontSize": "50%", | |
| "prefix": "", | |
| "prefixFontSize": "50%", | |
| "rangeMaps": [ | |
| { | |
| "from": "null", | |
| "text": "N/A", | |
| "to": "null" | |
| } | |
| ], | |
| "sparkline": { | |
| "fillColor": "rgba(31, 118, 189, 0.18)", | |
| "full": false, | |
| "lineColor": "rgb(31, 120, 193)", | |
| "show": false | |
| }, | |
| "tableColumn": "serverinfo", | |
| "targets": [ | |
| { | |
| "expr": "tomcat_serverinfo{job=\"$job\", instance=\"$instance\"}", | |
| "format": "table", | |
| "instant": true, | |
| "intervalFactor": 1, | |
| "refId": "A" | |
| } | |
| ], | |
| "thresholds": "", | |
| "title": "Server info", | |
| "transparent": false, | |
| "type": "singlestat", | |
| "valueFontSize": "100%", | |
| "valueMaps": [ | |
| { | |
| "op": "=", | |
| "text": "N/A", | |
| "value": "null" | |
| } | |
| ], | |
| "valueName": "avg" | |
| }, | |
| { | |
| "collapsed": false, | |
| "gridPos": { | |
| "h": 1, | |
| "w": 24, | |
| "x": 0, | |
| "y": 4 | |
| }, | |
| "id": 31, | |
| "panels": [], | |
| "repeat": "protocol", | |
| "title": "Protocol [$protocol]", | |
| "type": "row" | |
| }, | |
| { | |
| "cacheTimeout": null, | |
| "colorBackground": false, | |
| "colorValue": false, | |
| "colors": [ | |
| "#299c46", | |
| "rgba(237, 129, 40, 0.89)", | |
| "#d44a3a" | |
| ], | |
| "datasource": "$datasource", | |
| "format": "none", | |
| "gauge": { | |
| "maxValue": 100, | |
| "minValue": 0, | |
| "show": false, | |
| "thresholdLabels": false, | |
| "thresholdMarkers": true | |
| }, | |
| "gridPos": { | |
| "h": 4, | |
| "w": 4, | |
| "x": 2, | |
| "y": 5 | |
| }, | |
| "id": 14, | |
| "interval": null, | |
| "links": [], | |
| "mappingType": 1, | |
| "mappingTypes": [ | |
| { | |
| "name": "value to text", | |
| "value": 1 | |
| }, | |
| { | |
| "name": "range to text", | |
| "value": 2 | |
| } | |
| ], | |
| "maxDataPoints": 100, | |
| "nullPointMode": "connected", | |
| "nullText": null, | |
| "postfix": "", | |
| "postfixFontSize": "50%", | |
| "prefix": "", | |
| "prefixFontSize": "50%", | |
| "rangeMaps": [ | |
| { | |
| "from": "null", | |
| "text": "N/A", | |
| "to": "null" | |
| } | |
| ], | |
| "sparkline": { | |
| "fillColor": "rgba(31, 118, 189, 0.18)", | |
| "full": false, | |
| "lineColor": "rgb(31, 120, 193)", | |
| "show": false | |
| }, | |
| "tableColumn": "", | |
| "targets": [ | |
| { | |
| "expr": "tomcat_threadpool_maxthreads{job=\"$job\", instance=\"$instance\", protocol=\"$protocol\"}", | |
| "format": "time_series", | |
| "instant": true, | |
| "intervalFactor": 1, | |
| "legendFormat": "", | |
| "refId": "A" | |
| } | |
| ], | |
| "thresholds": "", | |
| "title": "Max threads", | |
| "type": "singlestat", | |
| "valueFontSize": "80%", | |
| "valueMaps": [ | |
| { | |
| "op": "=", | |
| "text": "N/A", | |
| "value": "null" | |
| } | |
| ], | |
| "valueName": "avg" | |
| }, | |
| { | |
| "cacheTimeout": null, | |
| "colorBackground": false, | |
| "colorValue": false, | |
| "colors": [ | |
| "#299c46", | |
| "rgba(237, 129, 40, 0.89)", | |
| "#d44a3a" | |
| ], | |
| "datasource": "$datasource", | |
| "format": "none", | |
| "gauge": { | |
| "maxValue": 100, | |
| "minValue": 0, | |
| "show": false, | |
| "thresholdLabels": false, | |
| "thresholdMarkers": true | |
| }, | |
| "gridPos": { | |
| "h": 4, | |
| "w": 4, | |
| "x": 6, | |
| "y": 5 | |
| }, | |
| "id": 12, | |
| "interval": null, | |
| "links": [], | |
| "mappingType": 1, | |
| "mappingTypes": [ | |
| { | |
| "name": "value to text", | |
| "value": 1 | |
| }, | |
| { | |
| "name": "range to text", | |
| "value": 2 | |
| } | |
| ], | |
| "maxDataPoints": 100, | |
| "nullPointMode": "connected", | |
| "nullText": null, | |
| "postfix": "", | |
| "postfixFontSize": "50%", | |
| "prefix": "", | |
| "prefixFontSize": "50%", | |
| "rangeMaps": [ | |
| { | |
| "from": "null", | |
| "text": "N/A", | |
| "to": "null" | |
| } | |
| ], | |
| "sparkline": { | |
| "fillColor": "rgba(31, 118, 189, 0.18)", | |
| "full": false, | |
| "lineColor": "rgb(31, 120, 193)", | |
| "show": false | |
| }, | |
| "tableColumn": "", | |
| "targets": [ | |
| { | |
| "expr": "tomcat_threadpool_minsparethreads{job=\"$job\", instance=\"$instance\", protocol=\"$protocol\"}", | |
| "format": "time_series", | |
| "instant": true, | |
| "intervalFactor": 1, | |
| "legendFormat": "", | |
| "refId": "A" | |
| } | |
| ], | |
| "thresholds": "", | |
| "title": "Min spare threads", | |
| "type": "singlestat", | |
| "valueFontSize": "80%", | |
| "valueMaps": [ | |
| { | |
| "op": "=", | |
| "text": "N/A", | |
| "value": "null" | |
| } | |
| ], | |
| "valueName": "avg" | |
| }, | |
| { | |
| "cacheTimeout": null, | |
| "colorBackground": false, | |
| "colorValue": false, | |
| "colors": [ | |
| "#299c46", | |
| "rgba(237, 129, 40, 0.89)", | |
| "#d44a3a" | |
| ], | |
| "datasource": "$datasource", | |
| "format": "none", | |
| "gauge": { | |
| "maxValue": 100, | |
| "minValue": 0, | |
| "show": false, | |
| "thresholdLabels": false, | |
| "thresholdMarkers": true | |
| }, | |
| "gridPos": { | |
| "h": 4, | |
| "w": 4, | |
| "x": 10, | |
| "y": 5 | |
| }, | |
| "id": 15, | |
| "interval": null, | |
| "links": [], | |
| "mappingType": 1, | |
| "mappingTypes": [ | |
| { | |
| "name": "value to text", | |
| "value": 1 | |
| }, | |
| { | |
| "name": "range to text", | |
| "value": 2 | |
| } | |
| ], | |
| "maxDataPoints": 100, | |
| "nullPointMode": "connected", | |
| "nullText": null, | |
| "postfix": "", | |
| "postfixFontSize": "50%", | |
| "prefix": "", | |
| "prefixFontSize": "50%", | |
| "rangeMaps": [ | |
| { | |
| "from": "null", | |
| "text": "N/A", | |
| "to": "null" | |
| } | |
| ], | |
| "sparkline": { | |
| "fillColor": "rgba(31, 118, 189, 0.18)", | |
| "full": false, | |
| "lineColor": "rgb(31, 120, 193)", | |
| "show": false | |
| }, | |
| "tableColumn": "", | |
| "targets": [ | |
| { | |
| "expr": "tomcat_threadpool_acceptcount{job=\"$job\", instance=\"$instance\", protocol=\"$protocol\"}", | |
| "format": "time_series", | |
| "instant": true, | |
| "intervalFactor": 1, | |
| "legendFormat": "", | |
| "refId": "A" | |
| } | |
| ], | |
| "thresholds": "", | |
| "title": "Accept count", | |
| "type": "singlestat", | |
| "valueFontSize": "80%", | |
| "valueMaps": [ | |
| { | |
| "op": "=", | |
| "text": "N/A", | |
| "value": "null" | |
| } | |
| ], | |
| "valueName": "avg" | |
| }, | |
| { | |
| "cacheTimeout": null, | |
| "colorBackground": false, | |
| "colorValue": false, | |
| "colors": [ | |
| "#299c46", | |
| "rgba(237, 129, 40, 0.89)", | |
| "#d44a3a" | |
| ], | |
| "datasource": "$datasource", | |
| "format": "none", | |
| "gauge": { | |
| "maxValue": 100, | |
| "minValue": 0, | |
| "show": false, | |
| "thresholdLabels": false, | |
| "thresholdMarkers": true | |
| }, | |
| "gridPos": { | |
| "h": 4, | |
| "w": 4, | |
| "x": 14, | |
| "y": 5 | |
| }, | |
| "id": 16, | |
| "interval": null, | |
| "links": [], | |
| "mappingType": 1, | |
| "mappingTypes": [ | |
| { | |
| "name": "value to text", | |
| "value": 1 | |
| }, | |
| { | |
| "name": "range to text", | |
| "value": 2 | |
| } | |
| ], | |
| "maxDataPoints": 100, | |
| "nullPointMode": "connected", | |
| "nullText": null, | |
| "postfix": "", | |
| "postfixFontSize": "50%", | |
| "prefix": "", | |
| "prefixFontSize": "50%", | |
| "rangeMaps": [ | |
| { | |
| "from": "null", | |
| "text": "N/A", | |
| "to": "null" | |
| } | |
| ], | |
| "sparkline": { | |
| "fillColor": "rgba(31, 118, 189, 0.18)", | |
| "full": false, | |
| "lineColor": "rgb(31, 120, 193)", | |
| "show": false | |
| }, | |
| "tableColumn": "", | |
| "targets": [ | |
| { | |
| "expr": "tomcat_threadpool_acceptorthreadcount{job=\"$job\", instance=\"$instance\", protocol=\"$protocol\"}", | |
| "format": "time_series", | |
| "instant": true, | |
| "intervalFactor": 1, | |
| "legendFormat": "", | |
| "refId": "A" | |
| } | |
| ], | |
| "thresholds": "", | |
| "title": "Acceptor thread count", | |
| "type": "singlestat", | |
| "valueFontSize": "80%", | |
| "valueMaps": [ | |
| { | |
| "op": "=", | |
| "text": "N/A", | |
| "value": "null" | |
| } | |
| ], | |
| "valueName": "avg" | |
| }, | |
| { | |
| "cacheTimeout": null, | |
| "colorBackground": false, | |
| "colorValue": false, | |
| "colors": [ | |
| "#299c46", | |
| "rgba(237, 129, 40, 0.89)", | |
| "#d44a3a" | |
| ], | |
| "datasource": "$datasource", | |
| "format": "none", | |
| "gauge": { | |
| "maxValue": 100, | |
| "minValue": 0, | |
| "show": false, | |
| "thresholdLabels": false, | |
| "thresholdMarkers": true | |
| }, | |
| "gridPos": { | |
| "h": 4, | |
| "w": 4, | |
| "x": 18, | |
| "y": 5 | |
| }, | |
| "id": 17, | |
| "interval": null, | |
| "links": [], | |
| "mappingType": 1, | |
| "mappingTypes": [ | |
| { | |
| "name": "value to text", | |
| "value": 1 | |
| }, | |
| { | |
| "name": "range to text", | |
| "value": 2 | |
| } | |
| ], | |
| "maxDataPoints": 100, | |
| "nullPointMode": "connected", | |
| "nullText": null, | |
| "postfix": "", | |
| "postfixFontSize": "50%", | |
| "prefix": "", | |
| "prefixFontSize": "50%", | |
| "rangeMaps": [ | |
| { | |
| "from": "null", | |
| "text": "N/A", | |
| "to": "null" | |
| } | |
| ], | |
| "sparkline": { | |
| "fillColor": "rgba(31, 118, 189, 0.18)", | |
| "full": false, | |
| "lineColor": "rgb(31, 120, 193)", | |
| "show": false | |
| }, | |
| "tableColumn": "", | |
| "targets": [ | |
| { | |
| "expr": "tomcat_threadpool_pollerthreadcount{job=\"$job\", instance=\"$instance\", protocol=\"$protocol\"}", | |
| "format": "time_series", | |
| "instant": true, | |
| "intervalFactor": 1, | |
| "legendFormat": "", | |
| "refId": "A" | |
| } | |
| ], | |
| "thresholds": "", | |
| "title": "Poller thread count", | |
| "type": "singlestat", | |
| "valueFontSize": "80%", | |
| "valueMaps": [ | |
| { | |
| "op": "=", | |
| "text": "N/A", | |
| "value": "null" | |
| } | |
| ], | |
| "valueName": "avg" | |
| }, | |
| { | |
| "aliasColors": {}, | |
| "bars": false, | |
| "dashLength": 10, | |
| "dashes": false, | |
| "datasource": "$datasource", | |
| "decimals": 0, | |
| "fill": 1, | |
| "gridPos": { | |
| "h": 9, | |
| "w": 12, | |
| "x": 0, | |
| "y": 9 | |
| }, | |
| "id": 2, | |
| "legend": { | |
| "avg": false, | |
| "current": false, | |
| "max": false, | |
| "min": false, | |
| "show": true, | |
| "total": false, | |
| "values": false | |
| }, | |
| "lines": true, | |
| "linewidth": 1, | |
| "links": [], | |
| "minSpan": 12, | |
| "nullPointMode": "null", | |
| "percentage": false, | |
| "pointradius": 5, | |
| "points": false, | |
| "renderer": "flot", | |
| "repeat": null, | |
| "repeatDirection": "h", | |
| "seriesOverrides": [], | |
| "spaceLength": 10, | |
| "stack": false, | |
| "steppedLine": false, | |
| "targets": [ | |
| { | |
| "expr": "increase(tomcat_bytesreceived_total{job=\"$job\", instance=\"$instance\", protocol=\"$protocol\"}[$__interval])", | |
| "format": "time_series", | |
| "interval": "60s", | |
| "intervalFactor": 1, | |
| "legendFormat": "Received {{protocol}}[{{port}}]", | |
| "refId": "A" | |
| }, | |
| { | |
| "expr": "increase(tomcat_bytessent_total{job=\"$job\", instance=\"$instance\", protocol=\"$protocol\"}[$__interval])", | |
| "format": "time_series", | |
| "interval": "60s", | |
| "intervalFactor": 1, | |
| "legendFormat": "Sent {{protocol}}[{{port}}]", | |
| "refId": "B" | |
| } | |
| ], | |
| "thresholds": [], | |
| "timeFrom": null, | |
| "timeRegions": [], | |
| "timeShift": null, | |
| "title": "Traffic send/recv", | |
| "tooltip": { | |
| "shared": true, | |
| "sort": 0, | |
| "value_type": "individual" | |
| }, | |
| "type": "graph", | |
| "xaxis": { | |
| "buckets": null, | |
| "mode": "time", | |
| "name": null, | |
| "show": true, | |
| "values": [] | |
| }, | |
| "yaxes": [ | |
| { | |
| "format": "decbytes", | |
| "label": null, | |
| "logBase": 1, | |
| "max": null, | |
| "min": null, | |
| "show": true | |
| }, | |
| { | |
| "format": "short", | |
| "label": null, | |
| "logBase": 1, | |
| "max": null, | |
| "min": null, | |
| "show": true | |
| } | |
| ], | |
| "yaxis": { | |
| "align": false, | |
| "alignLevel": null | |
| } | |
| }, | |
| { | |
| "aliasColors": {}, | |
| "bars": false, | |
| "dashLength": 10, | |
| "dashes": false, | |
| "datasource": "$datasource", | |
| "decimals": 0, | |
| "fill": 1, | |
| "gridPos": { | |
| "h": 9, | |
| "w": 12, | |
| "x": 12, | |
| "y": 9 | |
| }, | |
| "id": 4, | |
| "legend": { | |
| "alignAsTable": true, | |
| "avg": false, | |
| "current": true, | |
| "max": true, | |
| "min": true, | |
| "show": true, | |
| "total": false, | |
| "values": true | |
| }, | |
| "lines": true, | |
| "linewidth": 1, | |
| "links": [], | |
| "minSpan": 12, | |
| "nullPointMode": "null", | |
| "percentage": false, | |
| "pointradius": 5, | |
| "points": false, | |
| "renderer": "flot", | |
| "repeat": null, | |
| "repeatDirection": "h", | |
| "seriesOverrides": [], | |
| "spaceLength": 10, | |
| "stack": false, | |
| "steppedLine": false, | |
| "targets": [ | |
| { | |
| "expr": "increase(tomcat_requestcount_total{job=\"$job\", instance=\"$instance\", protocol=\"$protocol\"}[$__interval])", | |
| "format": "time_series", | |
| "interval": "60s", | |
| "intervalFactor": 1, | |
| "legendFormat": "Request {{protocol}}[{{port}}]", | |
| "refId": "A" | |
| }, | |
| { | |
| "expr": "increase(tomcat_errorcount_total{job=\"$job\", instance=\"$instance\", protocol=\"$protocol\"}[$__interval])", | |
| "format": "time_series", | |
| "interval": "60s", | |
| "intervalFactor": 1, | |
| "legendFormat": "Error {{protocol}}[{{port}}]", | |
| "refId": "B" | |
| } | |
| ], | |
| "thresholds": [], | |
| "timeFrom": null, | |
| "timeRegions": [], | |
| "timeShift": null, | |
| "title": "Request count / error count", | |
| "tooltip": { | |
| "shared": true, | |
| "sort": 0, | |
| "value_type": "individual" | |
| }, | |
| "type": "graph", | |
| "xaxis": { | |
| "buckets": null, | |
| "mode": "time", | |
| "name": null, | |
| "show": true, | |
| "values": [] | |
| }, | |
| "yaxes": [ | |
| { | |
| "decimals": 0, | |
| "format": "short", | |
| "label": "", | |
| "logBase": 1, | |
| "max": null, | |
| "min": null, | |
| "show": true | |
| }, | |
| { | |
| "format": "short", | |
| "label": null, | |
| "logBase": 1, | |
| "max": null, | |
| "min": null, | |
| "show": false | |
| } | |
| ], | |
| "yaxis": { | |
| "align": false, | |
| "alignLevel": null | |
| } | |
| }, | |
| { | |
| "aliasColors": {}, | |
| "bars": false, | |
| "dashLength": 10, | |
| "dashes": false, | |
| "datasource": "$datasource", | |
| "decimals": 0, | |
| "fill": 1, | |
| "gridPos": { | |
| "h": 9, | |
| "w": 24, | |
| "x": 0, | |
| "y": 18 | |
| }, | |
| "id": 10, | |
| "legend": { | |
| "alignAsTable": true, | |
| "avg": false, | |
| "current": true, | |
| "hideEmpty": false, | |
| "hideZero": false, | |
| "max": true, | |
| "min": true, | |
| "rightSide": true, | |
| "show": true, | |
| "total": false, | |
| "values": true | |
| }, | |
| "lines": true, | |
| "linewidth": 1, | |
| "links": [], | |
| "nullPointMode": "null", | |
| "percentage": false, | |
| "pointradius": 5, | |
| "points": false, | |
| "renderer": "flot", | |
| "seriesOverrides": [], | |
| "spaceLength": 10, | |
| "stack": false, | |
| "steppedLine": false, | |
| "targets": [ | |
| { | |
| "expr": "tomcat_threadpool_currentthreadcount{job=\"$job\", instance=\"$instance\", protocol=\"$protocol\"}", | |
| "format": "time_series", | |
| "intervalFactor": 1, | |
| "legendFormat": "current {{protocol}}[{{port}}]", | |
| "refId": "B" | |
| }, | |
| { | |
| "expr": "tomcat_threadpool_currentthreadsbusy{job=\"$job\", instance=\"$instance\", protocol=\"$protocol\"}", | |
| "format": "time_series", | |
| "intervalFactor": 1, | |
| "legendFormat": "current busy {{protocol}}[{{port}}]", | |
| "refId": "C" | |
| }, | |
| { | |
| "expr": "tomcat_threadpool_connectioncount{job=\"$job\", instance=\"$instance\", protocol=\"$protocol\"}", | |
| "format": "time_series", | |
| "intervalFactor": 1, | |
| "legendFormat": "connection {{protocol}}[{{port}}]", | |
| "refId": "E" | |
| }, | |
| { | |
| "expr": "tomcat_threadpool_keepalivecount{job=\"$job\", instance=\"$instance\", protocol=\"$protocol\"}", | |
| "format": "time_series", | |
| "intervalFactor": 1, | |
| "legendFormat": "keep alive {{protocol}}[{{port}}]", | |
| "refId": "A" | |
| } | |
| ], | |
| "thresholds": [], | |
| "timeFrom": null, | |
| "timeRegions": [], | |
| "timeShift": null, | |
| "title": "Threads", | |
| "tooltip": { | |
| "shared": true, | |
| "sort": 0, | |
| "value_type": "individual" | |
| }, | |
| "type": "graph", | |
| "xaxis": { | |
| "buckets": null, | |
| "mode": "time", | |
| "name": null, | |
| "show": true, | |
| "values": [] | |
| }, | |
| "yaxes": [ | |
| { | |
| "decimals": 0, | |
| "format": "short", | |
| "label": null, | |
| "logBase": 1, | |
| "max": null, | |
| "min": null, | |
| "show": true | |
| }, | |
| { | |
| "format": "short", | |
| "label": null, | |
| "logBase": 1, | |
| "max": null, | |
| "min": null, | |
| "show": true | |
| } | |
| ], | |
| "yaxis": { | |
| "align": false, | |
| "alignLevel": null | |
| } | |
| }, | |
| { | |
| "collapsed": false, | |
| "gridPos": { | |
| "h": 1, | |
| "w": 24, | |
| "x": 0, | |
| "y": 27 | |
| }, | |
| "id": 29, | |
| "panels": [], | |
| "repeat": null, | |
| "title": "Servlet stats", | |
| "type": "row" | |
| }, | |
| { | |
| "aliasColors": {}, | |
| "bars": false, | |
| "dashLength": 10, | |
| "dashes": false, | |
| "datasource": "$datasource", | |
| "decimals": 0, | |
| "fill": 1, | |
| "gridPos": { | |
| "h": 9, | |
| "w": 20, | |
| "x": 0, | |
| "y": 28 | |
| }, | |
| "id": 5, | |
| "legend": { | |
| "alignAsTable": true, | |
| "avg": false, | |
| "current": true, | |
| "max": true, | |
| "min": true, | |
| "rightSide": true, | |
| "show": true, | |
| "total": false, | |
| "values": true | |
| }, | |
| "lines": true, | |
| "linewidth": 1, | |
| "links": [], | |
| "nullPointMode": "null", | |
| "percentage": false, | |
| "pointradius": 5, | |
| "points": false, | |
| "renderer": "flot", | |
| "seriesOverrides": [], | |
| "spaceLength": 10, | |
| "stack": false, | |
| "steppedLine": false, | |
| "targets": [ | |
| { | |
| "expr": "sum(increase(tomcat_session_sessioncounter_total{job=\"$job\", instance=\"$instance\"}[$__interval])) by (instance)", | |
| "format": "time_series", | |
| "hide": false, | |
| "interval": "60s", | |
| "intervalFactor": 1, | |
| "legendFormat": "New", | |
| "refId": "A" | |
| }, | |
| { | |
| "expr": "sum(increase(tomcat_session_expiredsessions_total{job=\"$job\", instance=\"$instance\"}[$__interval])) by (instance)", | |
| "format": "time_series", | |
| "hide": false, | |
| "interval": "60s", | |
| "intervalFactor": 1, | |
| "legendFormat": "Expired", | |
| "refId": "B" | |
| }, | |
| { | |
| "expr": "sum(increase(tomcat_session_rejectedsessions_total{job=\"$job\", instance=\"$instance\"}[$__interval])) by (instance)", | |
| "format": "time_series", | |
| "hide": false, | |
| "interval": "60s", | |
| "intervalFactor": 1, | |
| "legendFormat": "Rejected", | |
| "refId": "C" | |
| } | |
| ], | |
| "thresholds": [], | |
| "timeFrom": null, | |
| "timeRegions": [], | |
| "timeShift": null, | |
| "title": "Session count", | |
| "tooltip": { | |
| "shared": true, | |
| "sort": 0, | |
| "value_type": "individual" | |
| }, | |
| "type": "graph", | |
| "xaxis": { | |
| "buckets": null, | |
| "mode": "time", | |
| "name": null, | |
| "show": true, | |
| "values": [] | |
| }, | |
| "yaxes": [ | |
| { | |
| "decimals": 0, | |
| "format": "none", | |
| "label": null, | |
| "logBase": 1, | |
| "max": null, | |
| "min": null, | |
| "show": true | |
| }, | |
| { | |
| "format": "short", | |
| "label": null, | |
| "logBase": 1, | |
| "max": null, | |
| "min": null, | |
| "show": false | |
| } | |
| ], | |
| "yaxis": { | |
| "align": false, | |
| "alignLevel": null | |
| } | |
| }, | |
| { | |
| "cacheTimeout": null, | |
| "colorBackground": false, | |
| "colorValue": false, | |
| "colors": [ | |
| "#299c46", | |
| "rgba(237, 129, 40, 0.89)", | |
| "#d44a3a" | |
| ], | |
| "datasource": "$datasource", | |
| "format": "none", | |
| "gauge": { | |
| "maxValue": 100, | |
| "minValue": 0, | |
| "show": false, | |
| "thresholdLabels": false, | |
| "thresholdMarkers": true | |
| }, | |
| "gridPos": { | |
| "h": 3, | |
| "w": 4, | |
| "x": 20, | |
| "y": 28 | |
| }, | |
| "id": 19, | |
| "interval": null, | |
| "links": [], | |
| "mappingType": 1, | |
| "mappingTypes": [ | |
| { | |
| "name": "value to text", | |
| "value": 1 | |
| }, | |
| { | |
| "name": "range to text", | |
| "value": 2 | |
| } | |
| ], | |
| "maxDataPoints": 100, | |
| "nullPointMode": "connected", | |
| "nullText": null, | |
| "postfix": "", | |
| "postfixFontSize": "50%", | |
| "prefix": "", | |
| "prefixFontSize": "50%", | |
| "rangeMaps": [ | |
| { | |
| "from": "null", | |
| "text": "N/A", | |
| "to": "null" | |
| } | |
| ], | |
| "sparkline": { | |
| "fillColor": "rgba(31, 118, 189, 0.18)", | |
| "full": false, | |
| "lineColor": "rgb(31, 120, 193)", | |
| "show": false | |
| }, | |
| "tableColumn": "", | |
| "targets": [ | |
| { | |
| "expr": "sum(tomcat_session_sessioncounter_total{job=\"$job\", instance=\"$instance\"} - tomcat_session_expiredsessions_total)", | |
| "format": "time_series", | |
| "instant": true, | |
| "intervalFactor": 1, | |
| "refId": "A" | |
| } | |
| ], | |
| "thresholds": "", | |
| "title": "Session current count", | |
| "type": "singlestat", | |
| "valueFontSize": "80%", | |
| "valueMaps": [ | |
| { | |
| "op": "=", | |
| "text": "N/A", | |
| "value": "null" | |
| } | |
| ], | |
| "valueName": "avg" | |
| }, | |
| { | |
| "cacheTimeout": null, | |
| "colorBackground": false, | |
| "colorValue": false, | |
| "colors": [ | |
| "#299c46", | |
| "rgba(237, 129, 40, 0.89)", | |
| "#d44a3a" | |
| ], | |
| "datasource": "$datasource", | |
| "format": "none", | |
| "gauge": { | |
| "maxValue": 100, | |
| "minValue": 0, | |
| "show": false, | |
| "thresholdLabels": false, | |
| "thresholdMarkers": true | |
| }, | |
| "gridPos": { | |
| "h": 3, | |
| "w": 4, | |
| "x": 20, | |
| "y": 31 | |
| }, | |
| "id": 20, | |
| "interval": null, | |
| "links": [], | |
| "mappingType": 1, | |
| "mappingTypes": [ | |
| { | |
| "name": "value to text", | |
| "value": 1 | |
| }, | |
| { | |
| "name": "range to text", | |
| "value": 2 | |
| } | |
| ], | |
| "maxDataPoints": 100, | |
| "nullPointMode": "connected", | |
| "nullText": null, | |
| "postfix": "", | |
| "postfixFontSize": "50%", | |
| "prefix": "", | |
| "prefixFontSize": "50%", | |
| "rangeMaps": [ | |
| { | |
| "from": "null", | |
| "text": "N/A", | |
| "to": "null" | |
| } | |
| ], | |
| "sparkline": { | |
| "fillColor": "rgba(31, 118, 189, 0.18)", | |
| "full": false, | |
| "lineColor": "rgb(31, 120, 193)", | |
| "show": false | |
| }, | |
| "tableColumn": "", | |
| "targets": [ | |
| { | |
| "expr": "sum(tomcat_session_sessioncounter_total{job=\"$job\", instance=\"$instance\"})", | |
| "format": "time_series", | |
| "instant": true, | |
| "intervalFactor": 1, | |
| "refId": "A" | |
| } | |
| ], | |
| "thresholds": "", | |
| "title": "Session total created", | |
| "type": "singlestat", | |
| "valueFontSize": "80%", | |
| "valueMaps": [ | |
| { | |
| "op": "=", | |
| "text": "N/A", | |
| "value": "null" | |
| } | |
| ], | |
| "valueName": "avg" | |
| }, | |
| { | |
| "cacheTimeout": null, | |
| "colorBackground": false, | |
| "colorValue": false, | |
| "colors": [ | |
| "#299c46", | |
| "rgba(237, 129, 40, 0.89)", | |
| "#d44a3a" | |
| ], | |
| "datasource": "$datasource", | |
| "format": "none", | |
| "gauge": { | |
| "maxValue": 100, | |
| "minValue": 0, | |
| "show": false, | |
| "thresholdLabels": false, | |
| "thresholdMarkers": true | |
| }, | |
| "gridPos": { | |
| "h": 3, | |
| "w": 4, | |
| "x": 20, | |
| "y": 34 | |
| }, | |
| "id": 21, | |
| "interval": null, | |
| "links": [], | |
| "mappingType": 1, | |
| "mappingTypes": [ | |
| { | |
| "name": "value to text", | |
| "value": 1 | |
| }, | |
| { | |
| "name": "range to text", | |
| "value": 2 | |
| } | |
| ], | |
| "maxDataPoints": 100, | |
| "nullPointMode": "connected", | |
| "nullText": null, | |
| "postfix": "", | |
| "postfixFontSize": "50%", | |
| "prefix": "", | |
| "prefixFontSize": "50%", | |
| "rangeMaps": [ | |
| { | |
| "from": "null", | |
| "text": "N/A", | |
| "to": "null" | |
| } | |
| ], | |
| "sparkline": { | |
| "fillColor": "rgba(31, 118, 189, 0.18)", | |
| "full": false, | |
| "lineColor": "rgb(31, 120, 193)", | |
| "show": false | |
| }, | |
| "tableColumn": "", | |
| "targets": [ | |
| { | |
| "expr": "sum(tomcat_session_expiredsessions_total{job=\"$job\", instance=\"$instance\"})", | |
| "format": "time_series", | |
| "instant": true, | |
| "intervalFactor": 1, | |
| "refId": "A" | |
| } | |
| ], | |
| "thresholds": "", | |
| "title": "Session total expired", | |
| "type": "singlestat", | |
| "valueFontSize": "80%", | |
| "valueMaps": [ | |
| { | |
| "op": "=", | |
| "text": "N/A", | |
| "value": "null" | |
| } | |
| ], | |
| "valueName": "avg" | |
| }, | |
| { | |
| "aliasColors": {}, | |
| "bars": false, | |
| "dashLength": 10, | |
| "dashes": false, | |
| "datasource": "$datasource", | |
| "decimals": 0, | |
| "fill": 1, | |
| "gridPos": { | |
| "h": 9, | |
| "w": 12, | |
| "x": 0, | |
| "y": 37 | |
| }, | |
| "id": 23, | |
| "legend": { | |
| "alignAsTable": true, | |
| "avg": false, | |
| "current": false, | |
| "hideZero": true, | |
| "max": false, | |
| "min": false, | |
| "rightSide": true, | |
| "show": true, | |
| "total": false, | |
| "values": false | |
| }, | |
| "lines": true, | |
| "linewidth": 1, | |
| "links": [], | |
| "nullPointMode": "null", | |
| "percentage": false, | |
| "pointradius": 5, | |
| "points": false, | |
| "renderer": "flot", | |
| "seriesOverrides": [], | |
| "spaceLength": 10, | |
| "stack": false, | |
| "steppedLine": false, | |
| "targets": [ | |
| { | |
| "expr": "topk(5, increase(tomcat_servlet_requestcount_total{job=\"$job\", instance=\"$instance\"}[$__interval]))", | |
| "format": "time_series", | |
| "interval": "60s", | |
| "intervalFactor": 1, | |
| "legendFormat": "module={{module}} servlet={{servlet}}", | |
| "refId": "A" | |
| } | |
| ], | |
| "thresholds": [], | |
| "timeFrom": null, | |
| "timeRegions": [], | |
| "timeShift": null, | |
| "title": "Top 5 servlet request count", | |
| "tooltip": { | |
| "shared": true, | |
| "sort": 0, | |
| "value_type": "individual" | |
| }, | |
| "type": "graph", | |
| "xaxis": { | |
| "buckets": null, | |
| "mode": "time", | |
| "name": null, | |
| "show": true, | |
| "values": [] | |
| }, | |
| "yaxes": [ | |
| { | |
| "decimals": 0, | |
| "format": "short", | |
| "label": null, | |
| "logBase": 1, | |
| "max": null, | |
| "min": null, | |
| "show": true | |
| }, | |
| { | |
| "format": "short", | |
| "label": null, | |
| "logBase": 1, | |
| "max": null, | |
| "min": null, | |
| "show": true | |
| } | |
| ], | |
| "yaxis": { | |
| "align": false, | |
| "alignLevel": null | |
| } | |
| }, | |
| { | |
| "aliasColors": {}, | |
| "bars": false, | |
| "dashLength": 10, | |
| "dashes": false, | |
| "datasource": "$datasource", | |
| "decimals": 0, | |
| "fill": 1, | |
| "gridPos": { | |
| "h": 9, | |
| "w": 12, | |
| "x": 12, | |
| "y": 37 | |
| }, | |
| "id": 24, | |
| "legend": { | |
| "alignAsTable": true, | |
| "avg": false, | |
| "current": true, | |
| "hideZero": true, | |
| "max": true, | |
| "min": true, | |
| "rightSide": true, | |
| "show": true, | |
| "sideWidth": null, | |
| "total": false, | |
| "values": true | |
| }, | |
| "lines": true, | |
| "linewidth": 1, | |
| "links": [], | |
| "nullPointMode": "null", | |
| "percentage": false, | |
| "pointradius": 5, | |
| "points": false, | |
| "renderer": "flot", | |
| "seriesOverrides": [], | |
| "spaceLength": 10, | |
| "stack": false, | |
| "steppedLine": false, | |
| "targets": [ | |
| { | |
| "expr": "topk(5, increase(tomcat_servlet_errorcount_total{job=\"$job\", instance=\"$instance\"}[$__interval]))", | |
| "format": "time_series", | |
| "interval": "60s", | |
| "intervalFactor": 1, | |
| "legendFormat": "module={{module}} servlet={{servlet}}", | |
| "refId": "A" | |
| } | |
| ], | |
| "thresholds": [], | |
| "timeFrom": null, | |
| "timeRegions": [], | |
| "timeShift": null, | |
| "title": "Top 5 servlet error count", | |
| "tooltip": { | |
| "shared": true, | |
| "sort": 0, | |
| "value_type": "individual" | |
| }, | |
| "type": "graph", | |
| "xaxis": { | |
| "buckets": null, | |
| "mode": "time", | |
| "name": null, | |
| "show": true, | |
| "values": [] | |
| }, | |
| "yaxes": [ | |
| { | |
| "decimals": 0, | |
| "format": "short", | |
| "label": null, | |
| "logBase": 1, | |
| "max": null, | |
| "min": null, | |
| "show": true | |
| }, | |
| { | |
| "format": "short", | |
| "label": null, | |
| "logBase": 1, | |
| "max": null, | |
| "min": null, | |
| "show": true | |
| } | |
| ], | |
| "yaxis": { | |
| "align": false, | |
| "alignLevel": null | |
| } | |
| }, | |
| { | |
| "aliasColors": {}, | |
| "bars": false, | |
| "dashLength": 10, | |
| "dashes": false, | |
| "datasource": "$datasource", | |
| "decimals": 0, | |
| "description": "Top 4 servlets average processing time per request in last 5 minutes", | |
| "fill": 1, | |
| "gridPos": { | |
| "h": 9, | |
| "w": 24, | |
| "x": 0, | |
| "y": 46 | |
| }, | |
| "id": 25, | |
| "legend": { | |
| "alignAsTable": true, | |
| "avg": false, | |
| "current": false, | |
| "hideZero": true, | |
| "max": false, | |
| "min": false, | |
| "rightSide": true, | |
| "show": true, | |
| "total": false, | |
| "values": false | |
| }, | |
| "lines": true, | |
| "linewidth": 1, | |
| "links": [], | |
| "nullPointMode": "null", | |
| "percentage": false, | |
| "pointradius": 5, | |
| "points": false, | |
| "renderer": "flot", | |
| "seriesOverrides": [], | |
| "spaceLength": 10, | |
| "stack": false, | |
| "steppedLine": false, | |
| "targets": [ | |
| { | |
| "expr": "topk(5, increase(tomcat_servlet_processingtime_total{job=\"$job\", instance=\"$instance\"}[$__interval]) / increase(tomcat_servlet_requestcount_total{job=\"$job\", instance=\"$instance\"}[$__interval]))", | |
| "format": "time_series", | |
| "instant": false, | |
| "interval": "60s", | |
| "intervalFactor": 1, | |
| "legendFormat": "module {{module}} servlet {{servlet}}", | |
| "refId": "B" | |
| } | |
| ], | |
| "thresholds": [], | |
| "timeFrom": null, | |
| "timeRegions": [], | |
| "timeShift": null, | |
| "title": "Top 5 servlets average processing time per request", | |
| "tooltip": { | |
| "shared": true, | |
| "sort": 0, | |
| "value_type": "individual" | |
| }, | |
| "type": "graph", | |
| "xaxis": { | |
| "buckets": null, | |
| "mode": "time", | |
| "name": null, | |
| "show": true, | |
| "values": [] | |
| }, | |
| "yaxes": [ | |
| { | |
| "decimals": null, | |
| "format": "ms", | |
| "label": null, | |
| "logBase": 1, | |
| "max": null, | |
| "min": null, | |
| "show": true | |
| }, | |
| { | |
| "format": "short", | |
| "label": null, | |
| "logBase": 1, | |
| "max": null, | |
| "min": null, | |
| "show": true | |
| } | |
| ], | |
| "yaxis": { | |
| "align": false, | |
| "alignLevel": null | |
| } | |
| } | |
| ], | |
| "refresh": "10s", | |
| "schemaVersion": 16, | |
| "style": "dark", | |
| "tags": [ | |
| "Tomcat8" | |
| ], | |
| "templating": { | |
| "list": [ | |
| { | |
| "current": { | |
| "text": "prometheus", | |
| "value": "prometheus" | |
| }, | |
| "hide": 0, | |
| "label": null, | |
| "name": "datasource", | |
| "options": [], | |
| "query": "prometheus", | |
| "refresh": 1, | |
| "regex": "", | |
| "skipUrlSync": false, | |
| "type": "datasource" | |
| }, | |
| { | |
| "current": { | |
| "value": "${VAR_JOB}", | |
| "text": "${VAR_JOB}" | |
| }, | |
| "hide": 0, | |
| "label": "Job", | |
| "name": "job", | |
| "options": [ | |
| { | |
| "value": "${VAR_JOB}", | |
| "text": "${VAR_JOB}" | |
| } | |
| ], | |
| "query": "${VAR_JOB}", | |
| "skipUrlSync": false, | |
| "type": "constant" | |
| }, | |
| { | |
| "allValue": ".*", | |
| "current": {}, | |
| "datasource": "$datasource", | |
| "definition": "", | |
| "hide": 0, | |
| "includeAll": false, | |
| "label": "Instance", | |
| "multi": false, | |
| "name": "instance", | |
| "options": [], | |
| "query": "label_values(jvm_info{job=\"$job\"}, instance)", | |
| "refresh": 2, | |
| "regex": "", | |
| "skipUrlSync": false, | |
| "sort": 1, | |
| "tagValuesQuery": "", | |
| "tags": [], | |
| "tagsQuery": "", | |
| "type": "query", | |
| "useTags": false | |
| }, | |
| { | |
| "allValue": "", | |
| "current": {}, | |
| "datasource": "$datasource", | |
| "definition": "", | |
| "hide": 0, | |
| "includeAll": true, | |
| "label": "Protocol", | |
| "multi": true, | |
| "name": "protocol", | |
| "options": [], | |
| "query": "label_values(tomcat_bytesreceived_total{job=\"$job\", instance=~\"$instance\"}, protocol)", | |
| "refresh": 1, | |
| "regex": "", | |
| "skipUrlSync": false, | |
| "sort": 1, | |
| "tagValuesQuery": "", | |
| "tags": [], | |
| "tagsQuery": "", | |
| "type": "query", | |
| "useTags": false | |
| } | |
| ] | |
| }, | |
| "time": { | |
| "from": "now-15m", | |
| "to": "now" | |
| }, | |
| "timepicker": { | |
| "refresh_intervals": [ | |
| "5s", | |
| "10s", | |
| "30s", | |
| "1m", | |
| "5m", | |
| "15m" | |
| ], | |
| "time_options": [ | |
| "5m", | |
| "15m", | |
| "1h", | |
| "6h", | |
| "12h", | |
| "24h", | |
| "2d", | |
| "7d", | |
| "30d" | |
| ] | |
| }, | |
| "timezone": "", | |
| "title": "Tomcat dashboard", | |
| "uid": "chanjarster-tomcat-dashboard", | |
| "version": 6 | |
| } |
Sign up for free
to join this conversation on GitHub.
Already have an account?
Sign in to comment
@chanjarster Continuing our conversation here about the use of
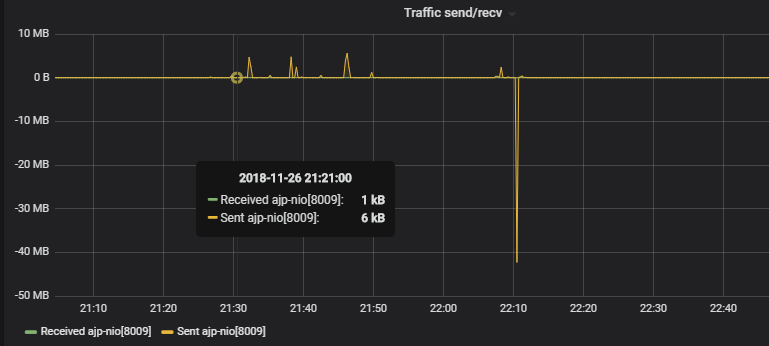

ideltafunction.The problem is that it doesn't adjust for counter resets. So it's possible to get negative values that don't make sense like here:
If you don't want to use
irateto display a rate it would be better to use theincreasefunction https://prometheus.io/docs/prometheus/latest/querying/functions/#increase