It would be good to have a few short sentences of introduction here to orient readers and give them an overview of the whole post.
- Why is small RNA-seq analysis important
- What types of analysis do you provide (this is in the pipeline section below), in a sentence.
- What is bcbio
- What will you show? Validation of the pipeline and demonstration of its capabilities.
We used samples from mirRQC project paper. This project provides samples with known, relative amounts of small RNAs, enabling comparison of quantitation and detection of miRNAs. The main goal was to test different platforms for miRNA detection, but these are also great samples for benchmarking tools. I am using them to test how bcbio-nextgen works with small RNA data.
Quoted from the paper, samples are (see below figure, lower panel):
Universal Human miRNA reference RNA (Agilent Technologies, #750700), human brain total RNA (Life Technologies, #AM6050), human liver total RNA (Life Technologies, #AM7960) and MS2-phage RNA (Roche, #10165948001) were diluted to a platform-specific concentration. ... Synthetic miRNA templates for let-7a-5p, let-7b-5p, let-7c, let-7d-5p, miR-302a-3p, miR-302b-3p, miR-302c-3p, miR-302d-3p, miR-133a and miR-10a-5p were synthesized by Integrated DNA Technologies and 5′ phosphorylated. Synthetic let-7 and miR-302 miRNAs were spiked into MS2-phage RNA and total human liver RNA, respectively, at 5 × 10⁶ copies/μg RNA.

You can read more about bcbio here. There are 4 main steps in the small RNA-seq pipeline:
- adapter removal
- miRNA quantification
- other small RNAs detection and quantification
- quality control metrics
We integrated cutadapt allowing a minimum read size of 17 nts and removing the adapter if it is at least 8 nts long.
bcbio uses
seqbuster for this
step. It has been used by
gEUvaids consortium
for miRNA quantification and allows
isomiRs analysis as well. Read more
about why isomiRs are important.
bcbio uses seqcluster to detect
unique units of transcription over the genome, allowing resolutions of small
RNAs found in multiple genomic locations. Normally
these small RNAs are dropped because they map multiple times on the genome and
require special analysis to avoid bias in the quantification. Read more about
why
other small RNAs are important.
bcbio summarizes Fastqc metrics for each sample. Together with different
metrics from the previous steps, the user has an idea of the quality of the
samples and the overall project. It includes fastqc results, size
distribution after adapter removal and amount of small RNAs mapped to miRNAs,
tRNA, rRNA, repeats among others. Other metrics like amount of data used until
the end of the analysis, or warning flags if the data is noisy are provided by
seqcluster and included in the final Rmd template report. (TODO: Provide a
description and pointer to what Rmarkdown is)
bcbio generates a
Rmd template report
to make easy the visualization of all the results from each of the steps. It
will be inside report folder in the working directory.
The mirRQC samples allow us to measure quantitation and detection
accuracy of specific miRs for the tools integrated in bcbio.
The size distribution shows easily the quality of your data. In a normal small RNA sample we should see a peak at 22/23 nt and maybe another at 26 or 31 depending on the biology of the samples.

note: there may be specific cases where this assumption is not true, but it applies to the majority of projects.
There are 4 samples that help to validate the quantification:
- A: universal human RNA sample
- B: human brain sample
- C: 25% of A + 75% of B
- D: 25% of B + 75% of A
So we can assume:
- If A > B then A > D > C > B
- If B > A then A < D < C < B
Note that C/D samples are swapped in the paper and in the GEO web. The text from the paper says:
These samples (termed miRQC A–D) consist of 100% Universal Human miRNA Reference RNA (UHmiRR; A), 100% human brain RNA (HBR; B) and two titrations thereof (C = 0.75A + 0.25B and D = 0.25A + 0.75B).
While the text in the GEO web says:
Source name miRQC C Organism Homo sapiens Characteristics biomaterial: Mixture of 25% UHRR and 75% HuBr Total RNA
Source name miRQC D Organism Homo sapiens Characteristics biomaterial: Mixture of 75% UHRR and 25% HuBr Total RNA
After the analysis with bcbio, we can calculate the amount of miRs that
follows the relative abundance rule. To measure this, I took the average from
the replicates and kept only the miRs with a median > 5 counts after
normalization (upper quantile normalization) among samples.
miRNAs which A > B are 111, and all of them follows A > D > C
miRNAs which B > A are 181 and 174 follows B > C > D
That is more than 95% of accuracy for miRs with more than 5 counts.
To evaluate specificity we used samples that included specific miRNAs that are not normally expressed there. These samples were analyzed in a different run.
we spiked in 8 synthetic miRNAs from two miRNA families into human liver RNA (miR-302a/b/c/d) or MS2-phage RNA (let-7a/b/c/d)
We should only see those miRNAs (let-7 and miR-302 families) in those samples.
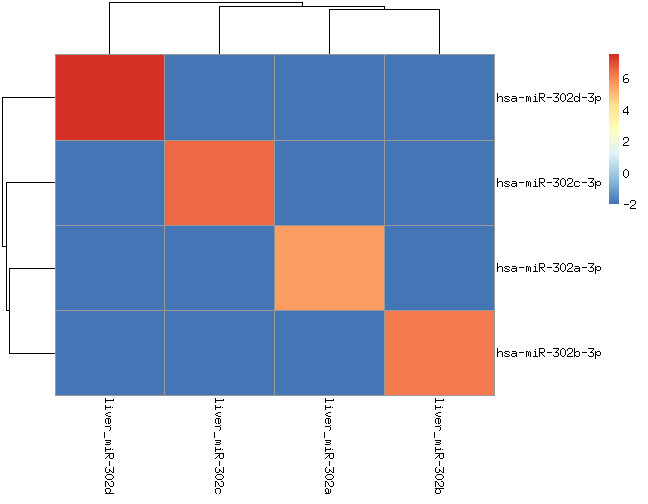
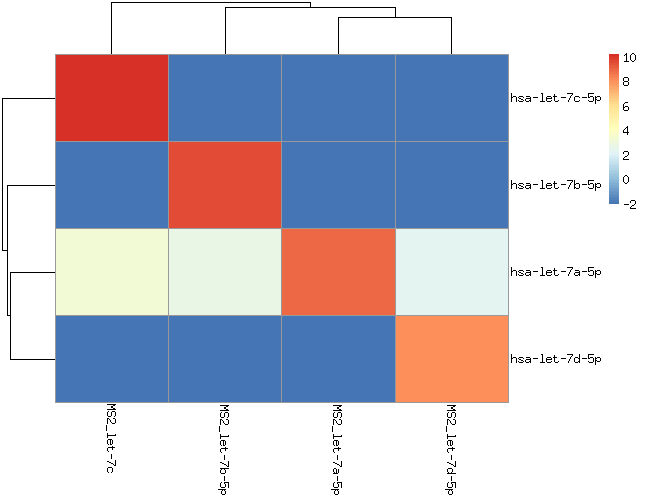
hsa-let-7a appears in all samples. If you check the processed data is not due to wrong alignment. It would be interesting to figure out whether this signal is because of contamintation or errors in sequencing or/and amplification.
Similarly to miRs, we can do the same for other small RNAs detected by
seqcluster. The results where very similar:
- clusters which A > B are 147, where 139 (75 are known miRNAs) follow D > C
- clusters which B > A are 230, where 222 (129 are known miRNAs) follow D > C
The time for 8 samples with 6 millions reads each was 3 hour and 19 minutes.
| Total | 3:19 | total cores | total memory GB |
|---|---|---|---|
| organize samples | 0 | 1 | 1 |
| trimming & miRNA | 0:21 | 8 | 20 |
| prepare | 0:01 | 1 | 8 |
| alignment | 0:07 | 6 | 42.1 |
| cluster | 2:49 | 1 | 8 |
| quality control | 0:01 | 8 | 20 |
| report | 0 | 1 | 1 |
It would be nice to have a conclusion here, similar to the intro -- re-emphasize the major points and suggest additional work.
- Harvard T.H. Chan School of Public Health for supporting the integration of small RNAseq pipeline in bcbio. Special thanks to @roryk and @chapmanb.
- Research Computing at Harvard Medical School: Chris Botka, Director of Research Computing and all the people in the team.
- Special thanks to the author of that papers to make data available. I encourage to use this data for any tool that analyzes small RNA data.