Last active
September 4, 2023 14:27
-
-
Save companje/11250db5c091511bf91faeeff7c5e7c4 to your computer and use it in GitHub Desktop.
clustering
This file contains bidirectional Unicode text that may be interpreted or compiled differently than what appears below. To review, open the file in an editor that reveals hidden Unicode characters.
Learn more about bidirectional Unicode characters
| # pip install scikit-learn | |
| import numpy as np | |
| from sklearn import metrics | |
| from sklearn.cluster import DBSCAN | |
| import matplotlib.pyplot as plt | |
| from sklearn.datasets import make_blobs | |
| from sklearn.preprocessing import StandardScaler | |
| centers = [[1, 1], [-1, -1], [1, -1], [-1,1]] #* (640,480) | |
| X, labels_true = make_blobs( | |
| n_samples=750, centers=centers, cluster_std=0.2, random_state=0 | |
| ) | |
| X = StandardScaler().fit_transform(X) | |
| db = DBSCAN(eps=0.3, min_samples=10).fit(X) | |
| labels = db.labels_ | |
| # Number of clusters in labels, ignoring noise if present. | |
| n_clusters_ = len(set(labels)) - (1 if -1 in labels else 0) | |
| n_noise_ = list(labels).count(-1) | |
| print("Estimated number of clusters: %d" % n_clusters_) | |
| print("Estimated number of noise points: %d" % n_noise_) | |
| plt.scatter(X[:, 0], X[:, 1]) | |
| plt.show() |
This file contains bidirectional Unicode text that may be interpreted or compiled differently than what appears below. To review, open the file in an editor that reveals hidden Unicode characters.
Learn more about bidirectional Unicode characters
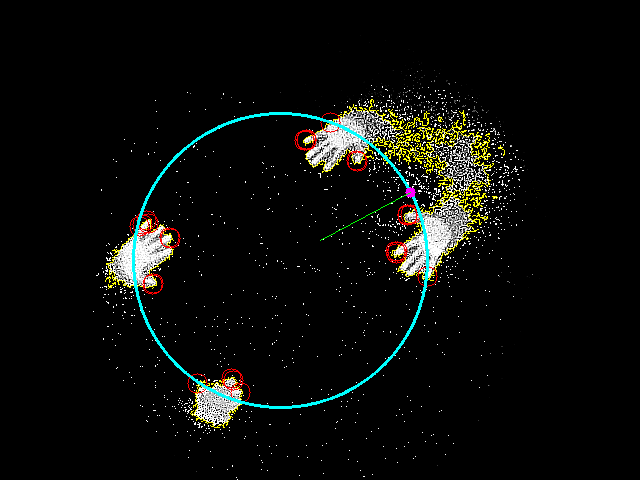
| 306 140 | |
| 304 140 | |
| 148 223 | |
| 233 380 | |
| 357 161 | |
| 170 238 | |
| 153 283 | |
| 407 215 | |
| 304 140 | |
| 146 220 | |
| 169 237 | |
| 395 251 | |
| 356 160 | |
| 240 392 | |
| 410 214 | |
| 306 139 | |
| 231 378 | |
| 407 214 | |
| 139 226 | |
| 330 122 | |
| 397 251 | |
| 396 253 | |
| 142 224 | |
| 427 276 | |
| 197 383 | |
| 152 284 |
Author
companje
commented
Sep 4, 2023

import numpy as np
from sklearn.cluster import DBSCAN
import matplotlib.pyplot as plt
from matplotlib.patches import Circle

points =  [
    [306, 140],
    [304, 140],
    [148, 223],
    [233, 380],
    [357, 161],
    [170, 238],
    [153, 283],
    [407, 215],
    [304, 140],
    [146, 220],
    [169, 237],
    [395, 251],
    [356, 160],
    [240, 392],
    [410, 214],
    [306, 139],
    [231, 378],
    [407, 214],
    [139, 226],
    [330, 122],
    [397, 251],
    [396, 253],
    [142, 224],
    [427, 276],
    [197, 383],
    [152, 284]
]


X = np.array(points)

canvas_width = 640
canvas_height = 480

dbscan = DBSCAN(eps=60, min_samples=3)
dbscan.fit(X)

labels = dbscan.labels_

# fig, ax = plt.subplots(figsize=(canvas_width / 100, canvas_height / 100))

# ax.set_aspect('equal', adjustable='box')

# ax.scatter(X[:, 0], X[:, 1], c=labels, cmap='viridis', alpha=1)

# for i, point in enumerate(X):
#     if True: # or labels[i] == -1:
#         eps_circle = Circle((point[0], point[1]), dbscan.eps, color='gray', fill=False)
#         ax.add_patch(eps_circle)

# ax.set_xlim(0, canvas_width)
# ax.set_ylim(0, canvas_height)

# ax.set_title(f'DBSCAN Clustering (eps={dbscan.eps})')
# ax.set_xlabel('X-axis')
# ax.set_ylabel('Y-axis')

# plt.show()

cluster_points = {}

cluster_points = {cluster: [point for point_idx, point in enumerate(points) if labels[point_idx] == cluster] for cluster in set(labels)}

for cluster, points in cluster_points.items():
    print(f"Cluster {cluster}: {points}")
Sign up for free
to join this conversation on GitHub.
Already have an account?
Sign in to comment