As a noob in investing, I kept hearing about record returns at top financial companies and hedge funds. So I figured, how hard can this be? Really?
Hence, I setup a personal challenge few years ago to not only learn but outperform top financial companies & hedge funds. I started working on algorithmic trading project. With an engineering background and a minor Economics, I had inadequate background, limited programming experience and funding; but loads of passion to accomplish this goal (a good enough combo).
Fast-forward 3 years later, I have created multiple trading algorithms in MATLAB, Python, AutoHotKey etc and managing 6 individual accounts (mine inclusive) with average annual returns of 15-20%; which is much better than average hedge fund, as measured by the Hedge Fund Research composite (HRFX) index. Not bad for a side project.
To date, there are three major trading algorithms, all working in unison to identify opportunities in global equities market.
| Algorithm | Codename | Description / Type |
|---|---|---|
| Trend Analyzer | Jenny | Solely based on technical analysis. |
| Momentum Analyzer | Peggy | Also based on technical analysis using momentum & volume indicators such as RSI, Stochastics Oscillator Index and MFI |
| Fund Analyzer | Anna | Based on fundamental analysis of companies financials. The most complex yet! |
Historical OHLCV data and standardized financials reports (Balance sheets, Income statements, Cash Flows, Financial Ratios) for allavailable years are downloaded per ticker.
For some companies such as IBM, I luckily have access to both annual / quarterly reports dating back to 1982 - some 7 years before I was born!
- Analysis is done once per-year and can last up to 2 months
This is running on custom-built PC with AMD FX-8150 8-Core 3.6GHz 8MB L2$, 8MB L3$ / 8 GB of DDR3-1333 RAM / blazing fast SSD. Unfortunately, most of time was spent downloading the lastest data in such a way to avoid CAPTCHA and excessive download restrictions. Workaround has been implemented; although I don't intend to apply this for high frequency trading at any point.
- Over 3000 U.S based and Global equities are analyzed
Earlier 80-90% of this was U.S based companies. However, I recently extended the watchlist to 20,000 equities and ETFs spanning all major world markets.
- Output is in XML/CSV format with fundamental & market rankings as well as BUY/HOLD/SELL signals.
For each company, Anna computes two rankings on 0 to 5 scale with 5 being the best. Each ranking compares the company's performance relative to its top 10 competitors as well as benchmark indices such S&P 500 or Dow Jones Index.
Fund(amental) ranking is computed per annum and compares company perfomance relative to peers in 6 major categories:
- Liquidity
- Profitability
- Debt Management
- Asset Management
- Growth
- Risk
Final fund ranking is expontenially weighted mean of all ranking over the years, with more weight given to ranking in recent years.
Market ranking is computed once based on Per share metrics (P/BV, P/E, EV/EBIT, EVA, Beta etc) and provides a snapshot of whether the company is currently undervalued or overvalued in the market.
This distinction is crucial as unlike fund ranking, market ranking is based on market valuation at the time the analysis was conducted.
Finally, technical analysis from both Jenny & Peggy spit out BUY/SELL/HOLD signals as well as useful metrics such as frequency of trades, average trade duration, average holding returns, target price and ex-date to meet target price.
Typically, my stock picks is for companies with just about average (>2.7) fund ranking and high market ranking (i.e undervalued).
Final output in CSV/XML format for FY2012 & FY2013 is shared on Git.
After first run, I quickly realized I needed a way to condense such the massive dataset into actionable picks. So I developed Medusa - a visualization platform built with Processing based on work by data artist Jer Thorp (awesome inspiration!). I integrated Leap Motion Library to allow for navigation via hand gestures. Yes, Minority Report style, but for picking stocks! Video coming soon!!!
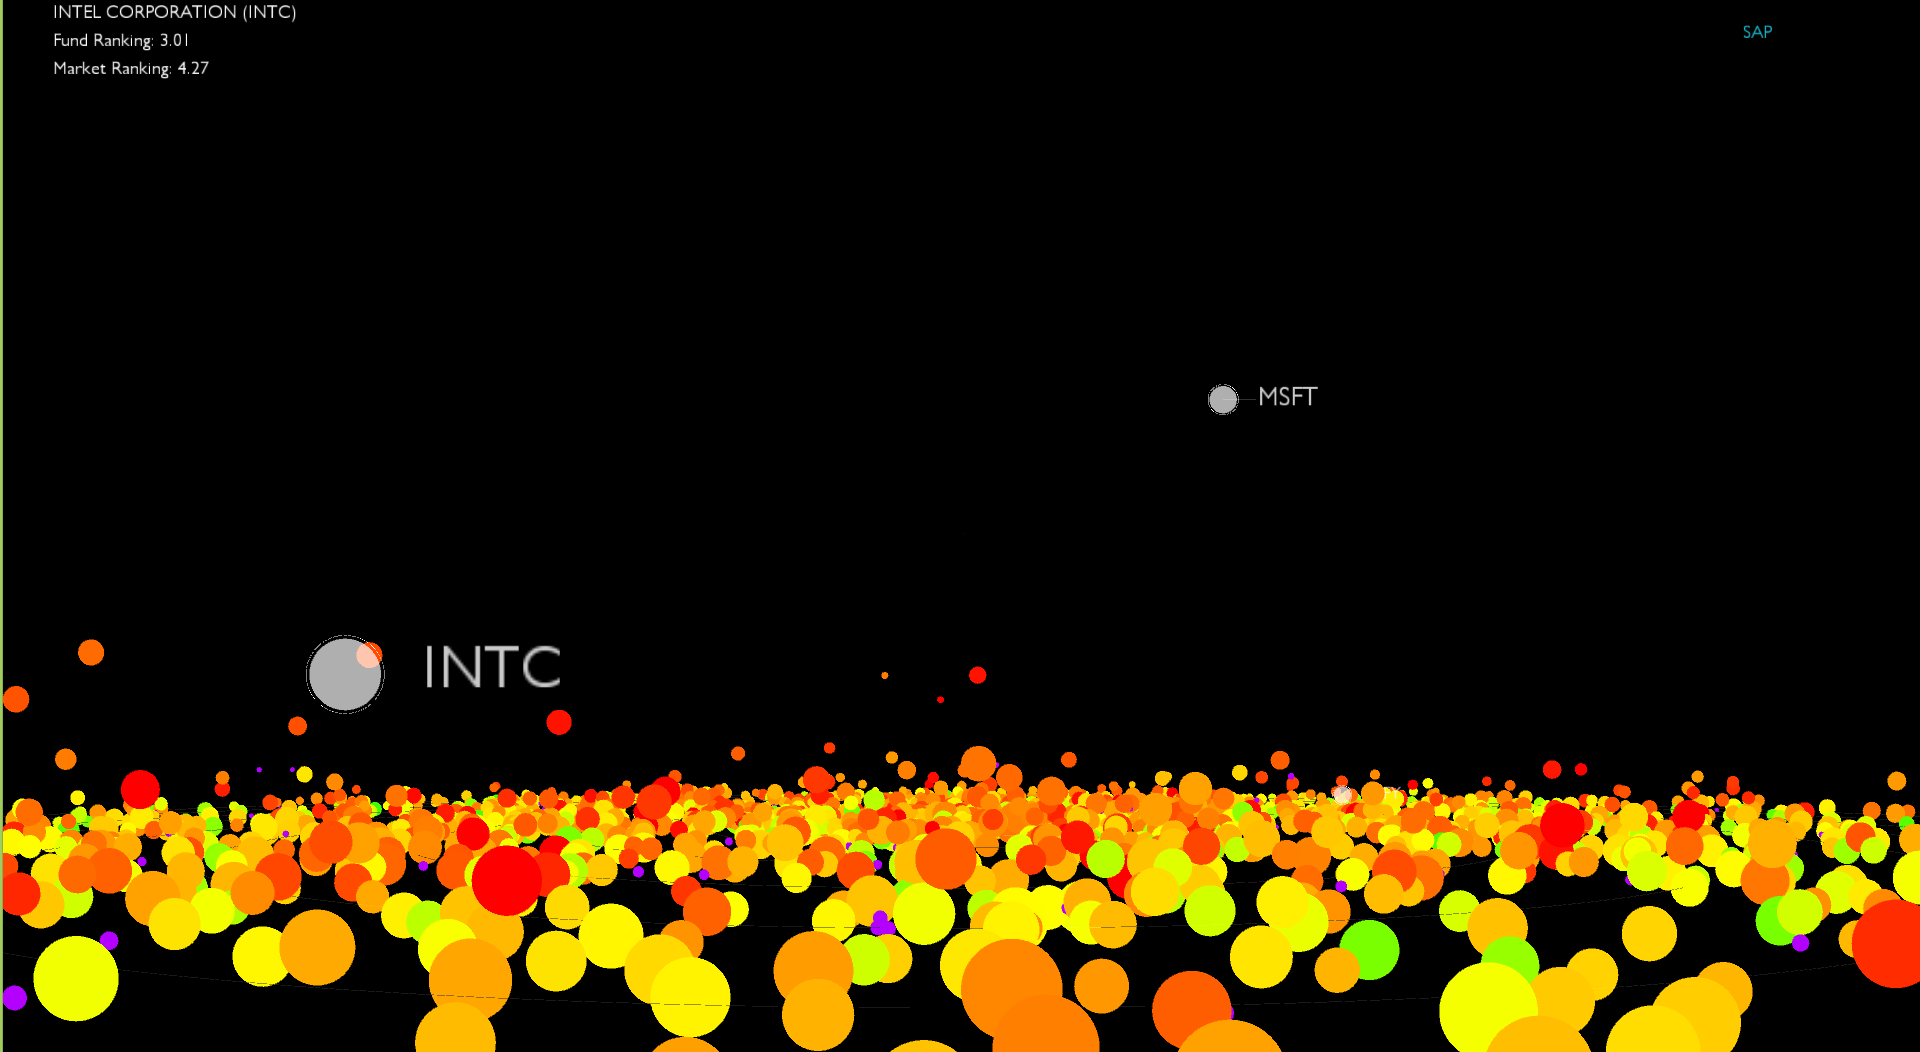
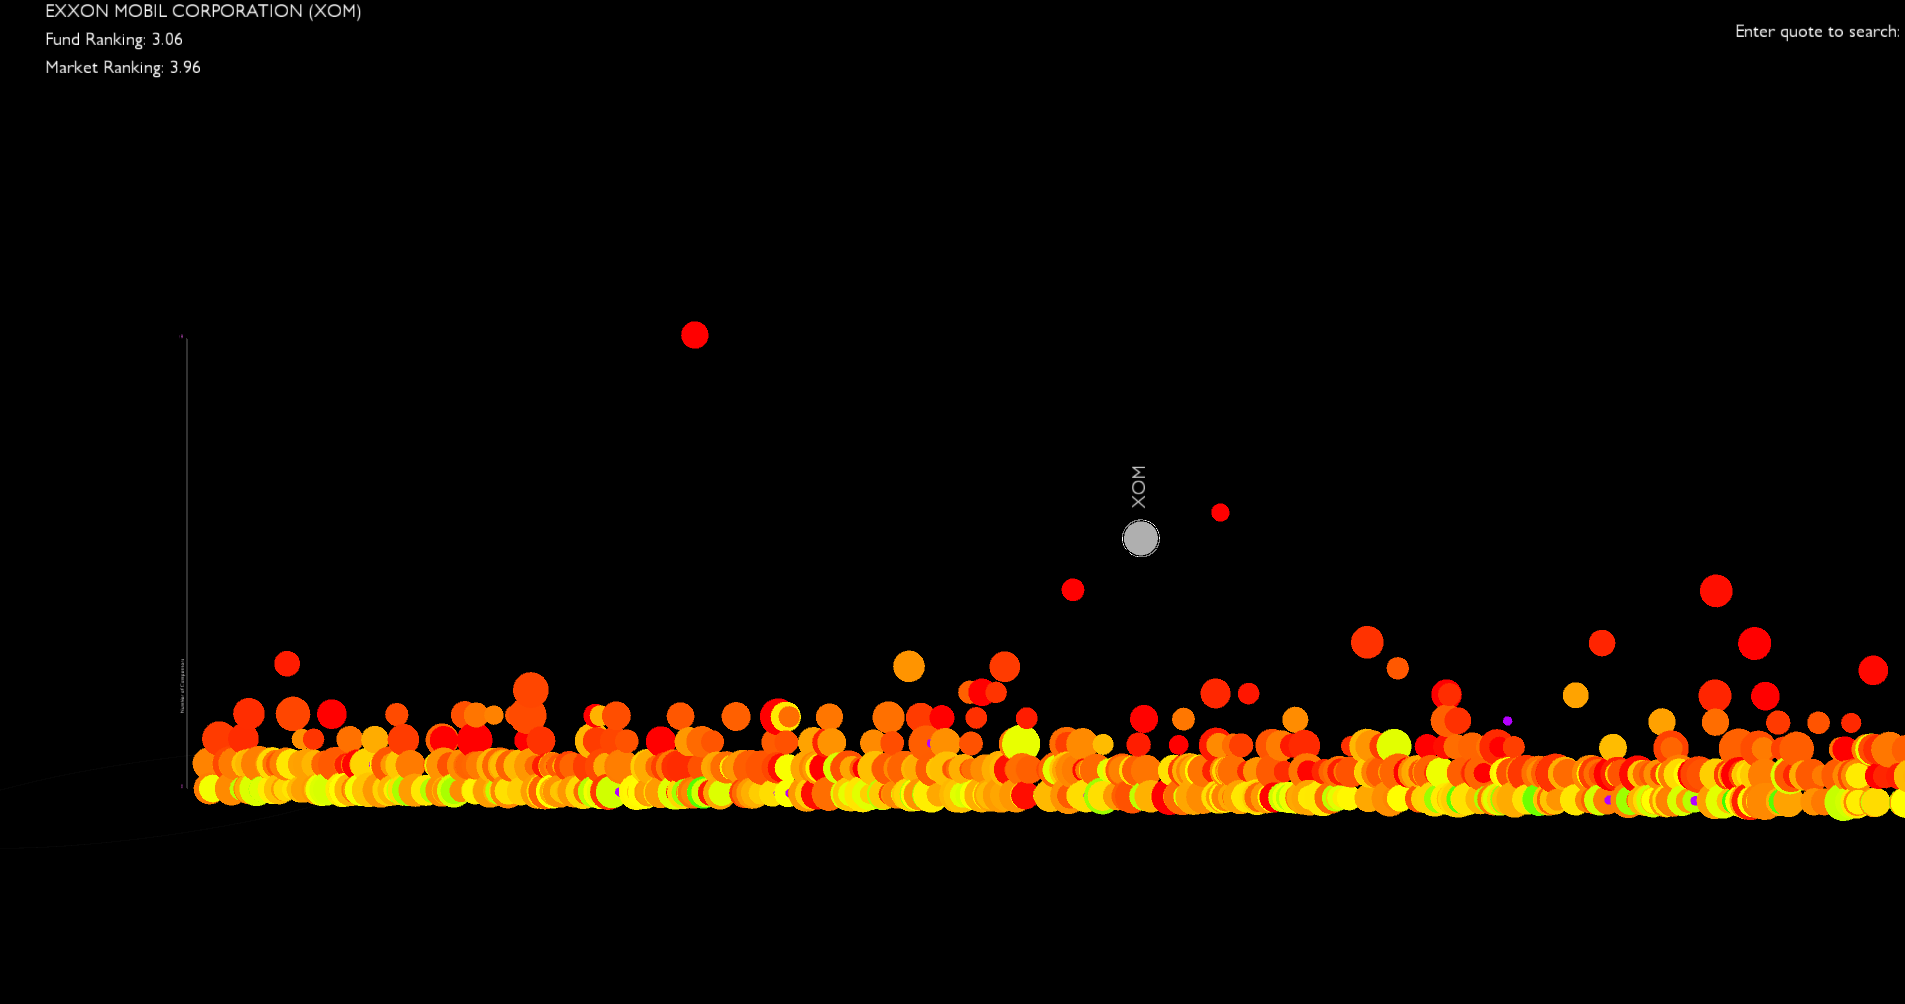
Companies are color coded with fund and market ranking indicated by hue and radius respectively. High ranking companies are RED hot and Low ranking more green-ish! For market valuation, undervalued are smaller in size! So picking out outperformers becomes as simple as finding big & REDish balls (pun intended).
Alas, once a year, I kick-off compute-intensive analysis and with a few hand gestures, pick out which outperformers for short-term and long-term horizon, trade & passively manage!
All data are retrieved via APIs, web scraping or combination of both. Key Stats and historical OHLCV data is from Google / Yahoo Finance. Standardized financials reports is from Mergent's Online Database.
Unlike competition with unlimited resources and access to Bloomberg Terminals, Factset, S&P Capital IQ etc; this entire project was done with a strict $0 budget in mind. Unfortunately, I can't redistribute this data.
With availablity of open source libraries such TA-Lib, zipline or websites such as Wikipedia, Investopedia, QuantConnect, Quantopian, Covestor, it's easy for an average person to learn investing, leverage available tools and outperform so-called top performers with limited resources. Just, let your passion drive you, put in the work, and most importantly have fun doing it!
Currently, I am focusing my part-time efforts on designing & developing Xantos (pronounced ZAH-AN-TOS), an advanced trading platform purely in Python that:
-
Allows easy import and analysis of any dataset, not just OHLCV data.
-
Monitors developed and emerging markets at close-to-real time.
-
Includes complex algorithms based on machine learning that predict events such Mergers & Acquisition, break-out companies with growing business sectors etc.
-
Make event-driven trades based on macro/micro economic reports, news such earning releases etc.
-
Comes batteries included with advanced portfolio risk management and an integrated order management system with direct access to broker platform.
-
And so much more...
Happy algo-trading!
Chukwuchebem Orakwue
So is this entirely private or are you open sourcing so that people may help you make it better...?