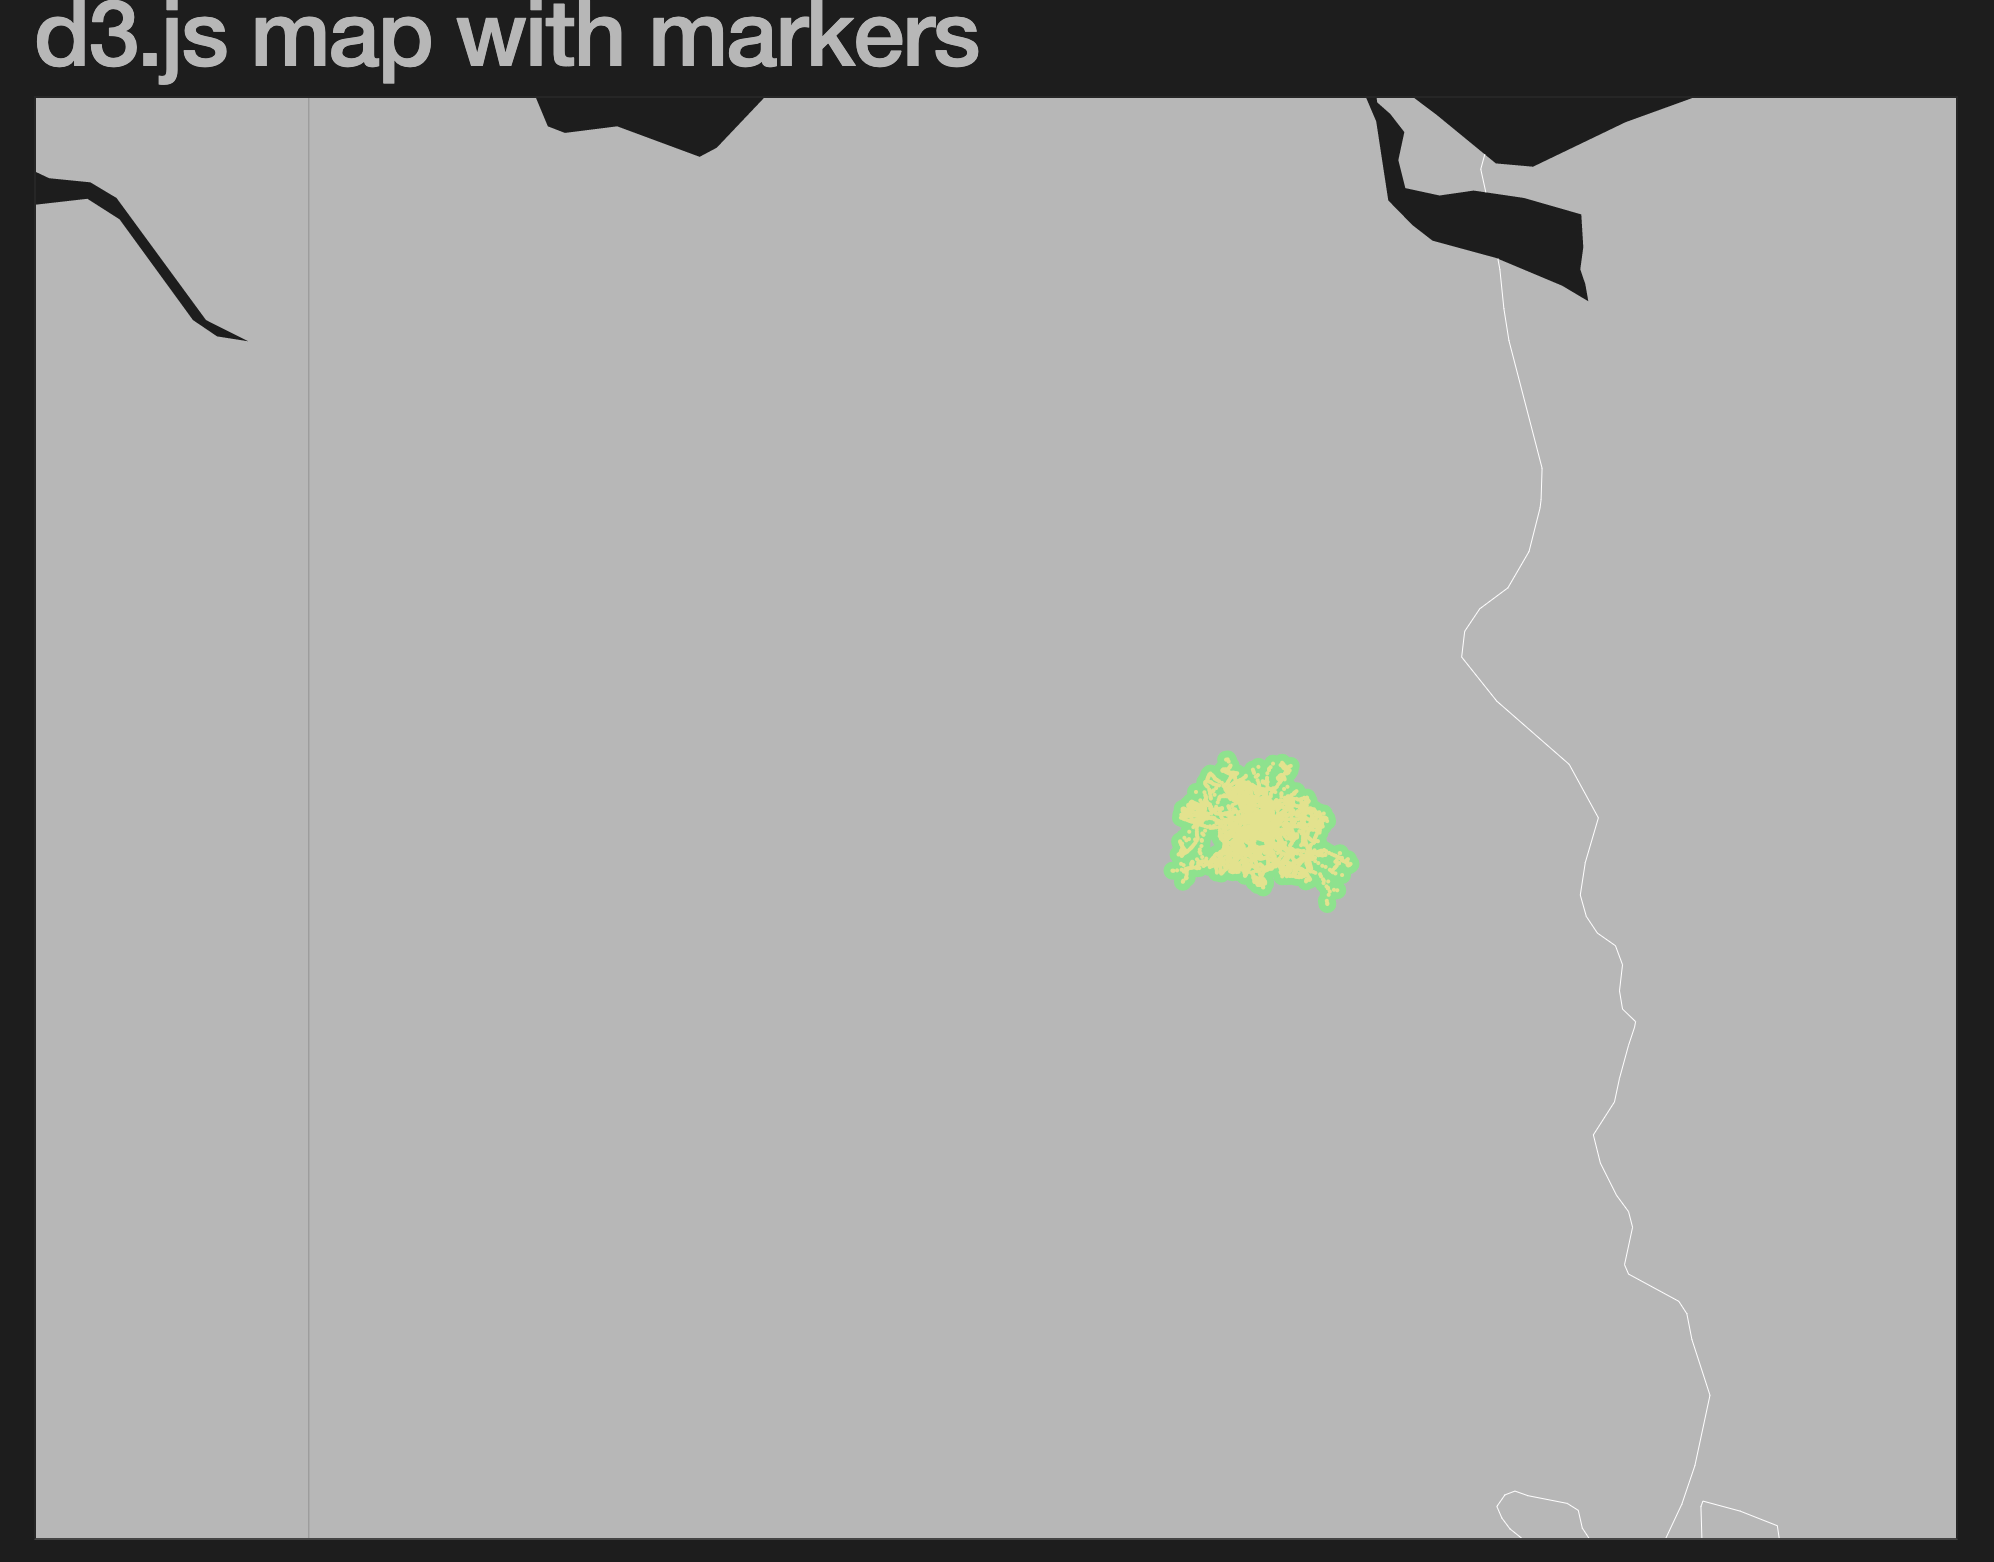
Easy example on how to put marker on a d3.js map.
You got 2 options:
- using d3.geo.path() which does all the work for you
- using svg circles and translating them via projection(d.geometry.coordinates)
| <!DOCTYPE html> | |
| <meta charset="utf-8"> | |
| <style> | |
| .graticule { | |
| fill: none; | |
| stroke: #777; | |
| stroke-opacity: .5; | |
| stroke-width: .5px; | |
| } | |
| .land { | |
| fill: #222; | |
| } | |
| .boundary { | |
| fill: none; | |
| stroke: #fff; | |
| stroke-width: .5px; | |
| } | |
| circle { | |
| fill: yellow; | |
| } | |
| .geopath { | |
| fill: green; | |
| } | |
| </style> | |
| <body> | |
| <script src="http://d3js.org/d3.v3.min.js"></script> | |
| <script src="http://d3js.org/topojson.v1.min.js"></script> | |
| <script> | |
| var width = 1200, | |
| height = 720; | |
| var projection = d3.geo.mercator() | |
| .scale(8000) | |
| .precision(.1) | |
| .center([13.320255,52.52831499]) | |
| .translate([width / 2, height / 2]) | |
| var path = d3.geo.path() | |
| .projection(projection); | |
| var graticule = d3.geo.graticule(); | |
| var svg = d3.select("body").append("svg") | |
| .attr("width", width) | |
| .attr("height", height); | |
| svg.append("path") | |
| .datum(graticule) | |
| .attr("class", "graticule") | |
| .attr("d", path); | |
| d3.json("world-50m.json", function(error, world) { | |
| svg.insert("path", ".graticule") | |
| .datum(topojson.feature(world, world.objects.land)) | |
| .attr("class", "land") | |
| .attr("d", path); | |
| svg.insert("path", ".graticule") | |
| .datum(topojson.mesh(world, world.objects.countries, function(a, b) { return a !== b; })) | |
| .attr("class", "boundary") | |
| .attr("d", path); | |
| }); | |
| d3.json("stops_berlin.geojson", function(error, data) { | |
| // using d3.geo.path() which does all the work for you | |
| svg.append("path") | |
| .datum(data) | |
| .classed("geopath", true) | |
| .attr("d", path) | |
| // or insert your own custom dots by hand | |
| svg.append("g") | |
| .selectAll("g") | |
| .data(data.features) | |
| .enter() | |
| .append("g") | |
| .attr("transform", function(d) { return "translate(" + projection(d.geometry.coordinates) + ")"; }) | |
| .append("circle") | |
| .attr("r", 1) | |
| }); | |
| d3.select(self.frameElement).style("height", height + "px"); | |
| </script> |
(Sorry about that, but we can’t show files that are this big right now.)
Hey Atul, this is a quiet old example but it still works: http://bl.ocks.org/cpietsch/dc76fc25863458a6a83e
In the link that you've provided, in doesn't indeed seem like it works.
Really struggling with clustering of icons on a. project and this seem the most promising so far.
What is the actual code that creates the clusters? I've laid out my location dots with this but they do not cluster. Data is in a CSV format and the x, y. placement is accurate. No errors.
Any pointers welcomed & much appreciated!

  svg
    .append("g")
    .attr("class", "cluster-markers")
    .selectAll("g")
    .data(locations)
    .enter()
    .append("g")
    .attr("data-date", (d) => console.log(d))
    .attr("transform", function (d) {
      return "translate(" + projection([d.lng, d.lat]) + ")";
    })
    .append("circle")
    .attr("r", 1);
data
data,,city,country,region,lat,lng,ccode,maintext,Tier,Category,,,
1979-02-01,,,Yemen,Middle East,15.552727,48.516388,YE,,,,,,
1979-02-11,,,Iran,Middle East,32.427908,53.688046,IR,,,,,,
You are using circles as the markers and it works. The example does not do clustering, it just overlays all the circles.
The green outline is created by
svg.append("path")
    .datum(data)
    .classed("geopath", true)
    .attr("d", path)
which makes it look like they are fused together.
Hope this answers your question.
I have downloaded the zip file but the map does not work. In the browser, it shows only a vertical line. It shows generated and elements when I inspected in developer toolbar.
Any help to get this example working?
I believe it's because the 'translate' values and the 'scale' values are too high. I cancelled the 'translate' attribute and reduced the scale to 100. If you do this, you can se the graticule
how would I go about using svg images as icons for my location dot markers?
is there a way to add them to the data directly?
as in:" icon,city,country,region,lat,lng,ccode
" (mysvgimage) ,Aden, Yemen,Middle East,15.552727,48.516388,YE ?
yes that should be doable by replacing the circles with images:
.append("circle")
    .attr("r", 1);
to
.append("image")
    .attr("width", 10)
    .attr("height", 10)
    .attr("href", d => d.icon)

I have downloaded the zip file but the map does not work. In the browser, it shows only a vertical line. It shows generated and elements when I inspected in developer toolbar.
Any help to get this example working?