This week's Riddler Express:
Abby and Beatrix are playing a game with two six-sided dice. Rather than having numbers on the sides like normal dice, however, the sides of these dice are either red or blue. In the game they're playing, Abby wins if the two dice land with the same color on top. Beatrix wins if the colors are not the same. One of the dice has five blue sides and one red side. If Abby and Beatrix have equal chances of winning the game, how many red and blue sides does the other die have?
While this wouldn't be too difficult to reason out, it's also a pretty straightforward simulation, and a good excuse for a stacked barchart. We start by creating the seven dice needed to compare.
df = data.frame(id = 1:6)
for(i in 0:6){
  die <- c(rep('red',i),rep('blue',6-i))
  df <- data.frame(df, die)
}
df <- df[,-1]
for(i in 1:ncol(df)){names(df)[i] <- paste('die',i, sep = '')}
df
##   die1 die2 die3 die4 die5 die6 die7
## 1 blue  red  red  red  red  red  red
## 2 blue blue  red  red  red  red  red
## 3 blue blue blue  red  red  red  red
## 4 blue blue blue blue  red  red  red
## 5 blue blue blue blue blue  red  red
## 6 blue blue blue blue blue blue  red
We then can use a simple function that determines the winner of a single game based on whether or not the two dice come up with the same color.
game <- function(die1, die2){
  if(as.character(sample(die1,1)) == as.character(sample(die2,1))){
    return('Abby')
  } else {
    return('Beatrix')
  }
}
From there we can simulate the results of as many games as we like. One die is always the one with five blue sides and one red side, and we'll play that die against all other possibilities.
tables = list()
for(i in 1:ncol(df)){
  winner = vector()
  for(j in 1:10000){
    winner[j] <- game(df$die2,df[,i])
  }
  tables[[i]] = table(winner)
}
data.frame(tables)[,c(1,seq(2,14,2))]
##    winner Freq Freq.1 Freq.2 Freq.3 Freq.4 Freq.5 Freq.6
## 1    Abby 8287   7292   6135   4986   3939   2742   1620
## 2 Beatrix 1713   2708   3865   5014   6061   7258   8380
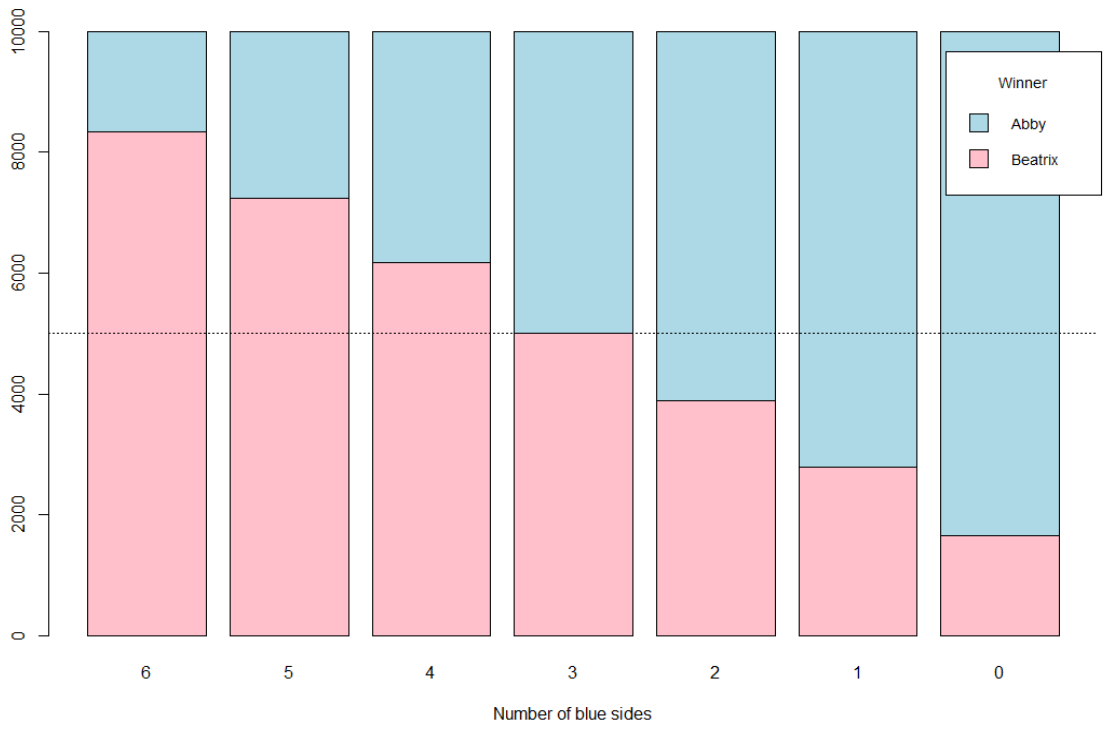
The table shows that Abby and Beatrix have equal chances of winning (the dashed line) if the second die has 3 red and 3 blue sides. We can also see this with the dashed line below.
barplot(as.matrix(data.frame(tables)[,seq(2,14,2)]), names = seq(6,0,-1),
  xlab = 'Number of blue sides', col = c('pink','lightblue'),
  legend = c("Beatrix","Abby"),
  args.legend = list(title = "Winner", x = 9.25, cex = .9))
abline(h = 5000, lty = 3, lwd = .5)