From the Riddler Express:
The Major League Baseball playoffs are about to begin. Based on the current playoff format, what is the best possible winning percentage a team can have in the playoffs without winning the World Series? And what is the worst possible winning percentage a team can have in the playoffs and still win the World Series?
The current format is:
- one play-in game for two non-division-winning wild card teams
- best 3-out-of 5 division series
- best 4-out-of-7 league championship series
- best 4-out-of-7 World Series
The minimum number of wins (if you win your division and don't need the play-in game) is 11, so if you end up playing the maximum in each series, the minimum winning percentage is:
(min_possible = (3 + 4 + 4)/(5 + 7 + 7))
## [1] 0.5789474
Conversely, the maximum winning percentage without winning the final best of seven World Series is
(max_possible = (1 + 3 + 4 + 3)/(1 + 3 + 4 + 7))
## [1] 0.7333333
The bonus question asks how close any actual teams have come. For that we'll use SQL through the SQLDF packages, baseball data from the Lahman database, and dplyr for some quick calculations.
library(Lahman)
library(sqldf)
library(dplyr)
Unfortunately my Lahman data only goes to 2016:
tail(SeriesPost[,-8])
##      yearID round teamIDwinner lgIDwinner teamIDloser lgIDloser wins ties
##  311   2016 ALDS2          CLE         AL         BOS        AL    3    0
##  312   2016  NLWC          SFN         NL         NYN        NL    1    0
##  313   2016  NLCS          CHN         NL         LAN        NL    4    0
##  314   2016 NLDS1          CHN         NL         SFN        NL    3    0
##  315   2016 NLDS2          LAN         NL         WAS        NL    3    0
##  316   2016    WS          CHN         NL         CLE        AL    4    0
So we'll use 2017 from Baseball Reference
dat_2017 <- data.frame(yearID = rep(2017, 9),
                       round = c('WS','ALCS', 'NLCS', 'ALDS1','ALDS2','NLDS1','NLDS2','ALWC','NLWC'),
                       teamIDwinner = c('HOU','HOU','LAN','NYA','HOU','LAN','CHN','NYA','ARI'),
                       lgIDwinner = c('AL','AL','NL','AL','AL','NL','NL','AL','NL'),
                       teamIDloser = c('LAN','NYA','CHN','CLE','BOS','ARI','WAS','MIN','COL'),
                       lgIDloser = c('NL','AL','NL','AL','AL','NL','NL','AL','NL'),
                       wins =   c(4,4,4,3,3,3,3,1,1),
                       losses = c(3,3,1,2,1,0,2,0,0),
                       ties = 0)
The data is in 'wide' format, so we'll make it long and bring in the 2017 results. I also add a marker for the World Series winner for each year.
playoffs <- sqldf("
            select yearID, round, teamIDwinner as team,
            cast(wins as float) wins,
            cast(losses as float) losses,
            case when round = 'WS' then 1 else 0 end WS_win
            from SeriesPost
            where yearID >= 1903
         union all
            select yearID, round, teamIDloser as team,
            cast(losses as float) wins, cast(wins as float) losses,  0 as WS_win
            from SeriesPost
            where yearID >= 1903
         union all
            select yearID, round, teamIDwinner as team,
            cast(wins as float) wins,
            cast(losses as float) losses,
            case when round = 'WS' then 1 else 0 end WS_win
            from dat_2017
         union all
            select yearID, round, teamIDloser as team,
            cast(losses as float) wins, cast(wins as float) losses,  0 as WS_win
            from dat_2017
            order by yearID desc, WS_win desc, wins desc")

head(playoffs)
##    yearID round team wins losses WS_win
##  1   2017    WS  HOU    4      3      1
##  2   2017  ALCS  HOU    4      3      0
##  3   2017  NLCS  LAN    4      1      0
##  4   2017 ALDS1  NYA    3      2      0
##  5   2017 ALDS2  HOU    3      1      0
##  6   2017 NLDS1  LAN    3      0      0
With that we can calculate the total winning percentage for the post-season for each team that year. I also included the team wins and losses for the season (from the Teams table) for later comparison, which again required entering the 2017 values manually.
win_pct <- sqldf("
           select a.yearID, a.team, sum(a.wins) wins, sum(a.losses) losses,
              round(sum(a.wins)/cast((sum(a.wins)+sum(a.losses)) as float),3) win_pct,
              b.WS_win, c.seas_wins, c.seas_losses
           from playoffs a
           inner join (select yearID, team, max(WS_win) WS_win
           from playoffs
           group by yearID, team) b
           on a.yearID = b.yearID
              and a.team = b.team
           left join (select yearID, teamID, lgID,
                      cast(W as float) seas_wins, cast(L as float) as seas_losses from Teams) c
           on a.yearID = c.yearID
              and a.team = c.teamID
           group by a.yearID, a.team
           order by a.yearID desc")

win_pct$seas_wins[1:10] <- c(93,93,92,102,87,101,104,85,91,97)
win_pct$seas_losses[1:10] <- 162 - win_pct$seas_wins[1:10]

win_pct <- win_pct %>% mutate(seas_w_pct = round(seas_wins/(seas_wins + seas_losses),3))

head(win_pct)
##   yearID team wins losses win_pct WS_win seas_wins seas_losses seas_w_pct
## 1   2017  ARI    1      3   0.250      0        93          69      0.574
## 2   2017  BOS    1      3   0.250      0        93          69      0.574
## 3   2017  CHN    4      6   0.400      0        92          70      0.568
## 4   2017  CLE    2      3   0.400      0       102          60      0.630
## 5   2017  COL    0      1   0.000      0        87          75      0.537
## 6   2017  HOU   11      7   0.611      1       101          61      0.623
If we look at all time playoffs (including every year since 1903, where the only playoffs were the World Series until 1969), three things stand out:
- one team alone has the highest winning percentage without winning the World Series (2014 Royals)
- that team had a lower in-season winning percentage than any of the other teams on the list
- the minimum winning percentage is shared by all teams that won a full (seven game) World Series
sqldf("select *
      from win_pct
      where (win_pct = (select max(win_pct) from win_pct where WS_win= 0)
        and WS_win = 0)
      or (win_pct = (select min(win_pct) from win_pct where WS_win= 1)
        and WS_win = 1)
      order by WS_win, seas_w_pct desc")
##    yearID team wins losses win_pct WS_win seas_wins seas_losses seas_w_pct
## 1    2014  KCA   11      4   0.733      0        89          73      0.549
## 2    1909  PIT    4      3   0.571      1       110          42      0.724
## 3    1912  BOS    4      3   0.571      1       105          47      0.691
## 4    1931  SLN    4      3   0.571      1       101          53      0.656
## 5    1940  CIN    4      3   0.571      1       100          53      0.654
## 6    1955  BRO    4      3   0.571      1        98          55      0.641
## 7    1968  DET    4      3   0.571      1       103          59      0.636
## 8    1956  NYA    4      3   0.571      1        97          57      0.630
## 9    1947  NYA    4      3   0.571      1        97          57      0.630
## 10   1946  SLN    4      3   0.571      1        98          58      0.628
## 11   1967  SLN    4      3   0.571      1       101          60      0.627
## 12   1934  SLN    4      3   0.571      1        95          58      0.621
## 13   1925  PIT    4      3   0.571      1        95          58      0.621
## 14   1960  PIT    4      3   0.571      1        95          59      0.617
## 15   1957  ML1    4      3   0.571      1        95          59      0.617
## 16   1952  NYA    4      3   0.571      1        95          59      0.617
## 17   1965  LAN    4      3   0.571      1        97          65      0.599
## 18   1958  NYA    4      3   0.571      1        92          62      0.597
## 19   1924  WS1    4      3   0.571      1        92          62      0.597
## 20   1962  NYA    4      3   0.571      1        96          66      0.593
## 21   1926  SLN    4      3   0.571      1        89          65      0.578
## 22   1945  DET    4      3   0.571      1        88          65      0.575
## 23   1964  SLN    4      3   0.571      1        93          69      0.574
## 24   1985  KCA    8      6   0.571      1        91          71      0.562
If we focus on the Royals that year, we can see that they had a remarkable playoff run. Starting with the play-in game, they won every single game until they got to the World Series. And even there they lost the 7th and final game by one run.
sqldf("select yearID, round, team, wins, losses
      from playoffs
      where yearID = 2014 and team = 'KCA'
      order by losses, wins ")
##    yearID round team wins losses
##  1   2014  ALWC  KCA    1      0
##  2   2014 ALDS1  KCA    3      0
##  3   2014  ALCS  KCA    4      0
##  4   2014    WS  KCA    3      4
This wasn't how they played all year: with a .55 season winning percentage and only 89 wins on the year, they clearly got hot at the right time.
sqldf("select *
      from win_pct
      where (win_pct = (select max(win_pct) from win_pct where WS_win= 0)
        and WS_win = 0)")
##    yearID team wins losses win_pct WS_win seas_wins seas_losses seas_w_pct
##  1   2014  KCA   11      4   0.733      0        89          73      0.549
Ironically, in the current playoff format, one of the two teams with the lowest winning percentage among World Series winners is the 2011 St. Louis Cardinals, the local rival for the Royals. Their seasons were remarkably similar, separated by one game in the regular season. The difference was that while the Cardinals lost 3 more games during the playoffs, they won the one extra game they needed:
sqldf("select *
      from win_pct
      where (win_pct = (select max(win_pct) from win_pct where WS_win= 0)
        and WS_win = 0)
      or (win_pct = (select min(win_pct) from win_pct where WS_win= 1 and wins > 8)
        and WS_win = 1)
      order by WS_win, seas_w_pct")
##    yearID team wins losses win_pct WS_win seas_wins seas_losses seas_w_pct
##  1   2014  KCA   11      4   0.733      0        89          73      0.549
##  2   2011  SLN   11      7   0.611      1        90          72      0.556
##  3   2017  HOU   11      7   0.611      1       101          61      0.623
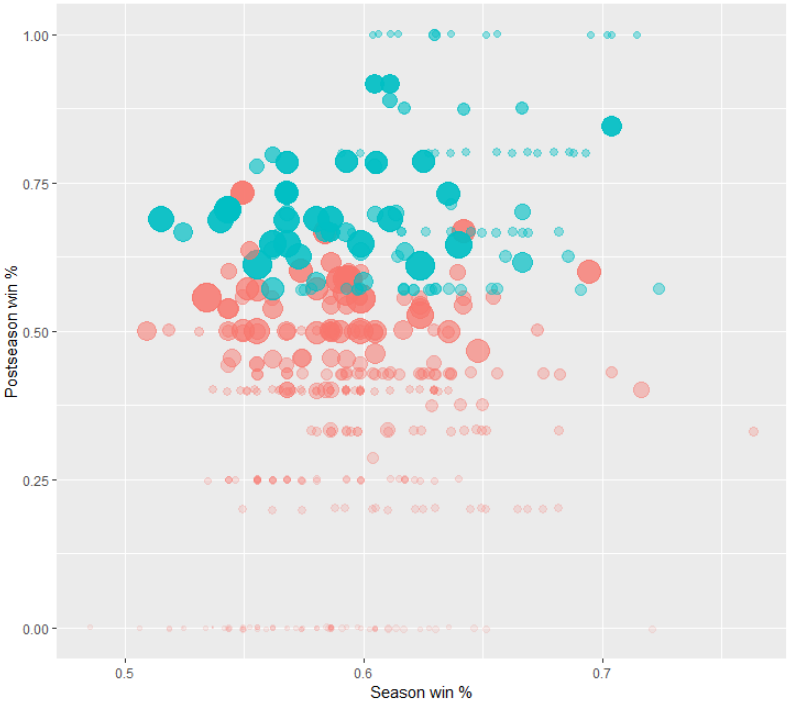
The following is a plot of the outcome. The graph plots regular season winning percentage against post-season winning percentage. The features are as follows:
- color: green = World Series winner, red = non-winner (World Series or earlier)
- size: total number of games played
- shading: total wins
The 2014 Royals stand out in the top left corner, as the large solid red circle. Given their playoff winning percentage, by pretty much any nearest-neighbors algorithm they'd be mistakenly classified as World Series winners.
All of the teams that won zero games line up lightly along the bottom; those who swept the World Series (with no prior games) make up the small, lightly colored top row. In the middle we can see that teams with a higher winning percentage during the year are a little more likely to win the World Series, but there's plenty of variation.
Code is on Github