Parallelizing Javascript Workloads - Building High Performance Graphs with Plotly.js and webpack-worker
Recently, we've been playing around with plotting various graphs in a react application with Plotly.js. It became clear pretty quickly that working with large data sets on the main application thread is simply not an option. Dragging a date range slider to filter graphs is jarring, not the smooth experience we're after.
Enter WebWorkers.
WebWorkers allow offloading CPU intensive tasks to other threads and are supported by pretty much all modern web browsers. However, they are a very low level mechanism, exposing only a simple message passing API for communication. The webpack-worker package provides us with a cleaner and more intuitive abstraction based on promises.
To demonstrate, we're going to build a graph that shows the top 10 movers from some historical stock market data available at http://pages.swcp.com/stocks/. We're also going to add a date range slider to dynamically pick the date range to analyze.
The data consists of a year of stock prices for 242 stocks in CSV format, one line per stock, per day. For example:
20090916,AMZN,85.97,90.98,85.9,90.7,131142
That’s the date, stock symbol, opening, high, low, and closing prices, I'm not sure what the last column refers to. We’re going to duplicate the data so we effectively have 5 years worth of data. This destroys any integrity in the results, but we’re not here to analyze stocks!
There is a considerable amount of work for the app to do to convert this style data into the format we need, particularly when working over many years worth of data. The details of the implementation aren't relevant to this post, but the complete sample is available in the github repository.
You can see a working example that compares using WebWorkers with running everything on the main UI thread here.
The webpack-worker package provides simple APIs based around promises for declaring and consuming worker code. It provides models for both single long running processes and APIs that can be called multiple times. We're going to use the API model as we will need to recalculate the graph data as the user drags the slider.
Based on our requirements above, our worker might look something like:
https://gist.github.com/cf87e5e7d12254cb223a3f5167244b26
You'll notice that this module doesn't export anything. That's because WebWorkers run in an isolated thread - this module is the entry point for the WebWorker. webpack-worker wraps the API returned and handles the low level communication for us. We'll talk about how to use webpack to create a bundle for our worker a little bit later.
webpack-worker generates a client API for us, based off the API we specify in the worker. Note that currently only a single argument can be provided to API calls and initialization.
Let's take a look at how our graph component might look without filters. We'll add those next.
https://gist.github.com/06b969834d8203791e16efddc9464bdd
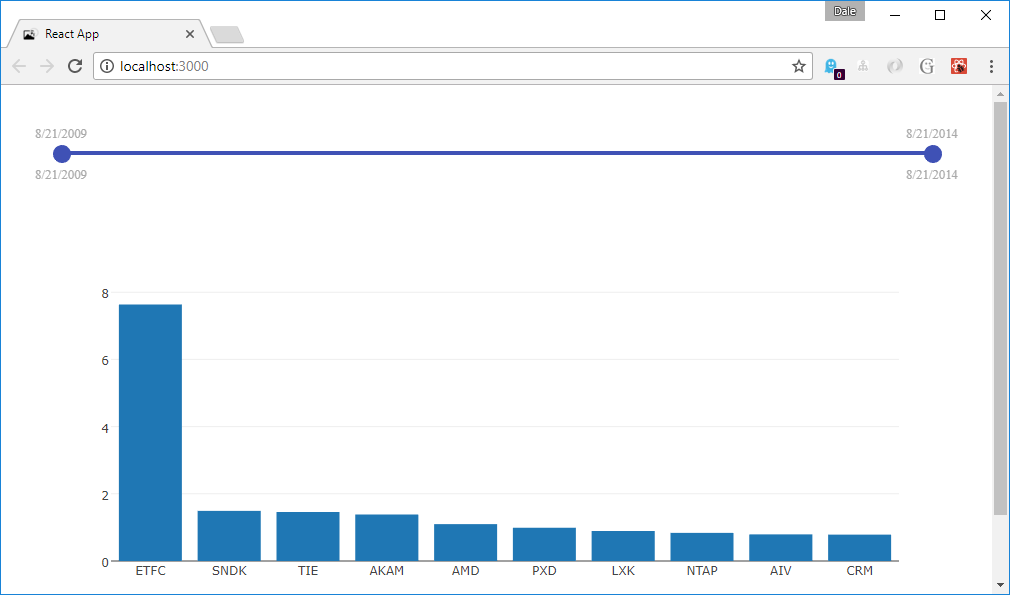
Pretty simple stuff. You'll notice we kept graph rendering logic separate in the renderGraph function. We'll reuse this when we add a date filter. This ends up looking something like:
For a simple solution to our UI needs, we'll use the react-input-range NPM package. Let's add it to our component:
https://gist.github.com/d67ca665a7eebe75653d1b552a1261e0
This ends up looking something like:
Things are starting to look pretty good! Now, as we drag the date slider, the graph updates.
There’s a problem, though. As we drag the slider, it queues up a filter operation for every mouse move event onto our worker, which tirelessly attempts to fulfill all of our requests... long after we’ve finished dragging the slider.
Fortunately, webpack-worker gives us a simple way to throttle our requests to produce the most responsive behavior. Applying it is simple:
https://gist.github.com/21505b70c3908c87b5cd0f4613b3fbe4
The applyTo function attaches a throttle to all function members of the supplied object. When throttled, if requests are made while the worker is already busy, only the most recent request is queued, all others are dropped.
When requests are dropped, the returned promise is rejected, so we need to handle the rejection in our renderGraph function:
https://gist.github.com/95eb1859e66fe1cfe9104735f3214915
As discussed, worker processes are isolated threads that require their own entry point. Correspondingly, we can create entry points in our webpack configuration. This is a simple matter of creating a worker node in the entry hash, for example:
https://gist.github.com/0528ca9d892e6b589d157fdab8106900
If your app was created with create-react-app, there are a couple of additional steps that are described here.
You can see a working example of what we've discussed here contrasted with running everything on the main UI thread here.
The use case discussed here is purely to demonstrate the impact of using WebWorkers - webpack-worker can be used for executing any Javascript code within a WebWorker, not just calculating graph data. It's also worth noting that webpack-worker will work with other bundling systems like browserify.
The full source to this sample is available in the webpack-worker repository here.

