To debug Php code, it's necessary to activate an extension on the Php server. And a client plugin in an editor like Notepad++ or Atom.
Be careful! There are differences between the versions, we are configuring debug for Php7.
Download the latest xdebug.dll from: https://xdebug.org/download.php

If you're running Apache (or IIS) as FastCGI (or CGI) then you need the Non Thread Safe version.
If you're running Apache as default (as a Module), then you'll need the more traditional Thread Safe version.
Please note: This all only applies to Windows users.

Here I downloaded a "thread safe" version and put it inside the ext folder.
Add following at the session [xdebug] of your php.ini file:
[xdebug]
zend_extension="c:/php/php7/ext/php_xdebug-2.5.5-7.1-vc14.dll"
xdebug.profiler_output_dir = "c:/php/php7/tmp/xdebug"
xdebug.profiler_output_name = "cachegrind.out.%p"
xdebug.profiler_enable = 1
xdebug.profiler_append=0
xdebug.extended_info=1
xdebug.remote_enable=1
xdebug.remote_handler=dbgp
xdebug.remote_mode=req
xdebug.remote_host=127.0.0.1
xdebug.remote_port=9000
xdebug.idekey=xdebug
xdebug.remote_log="c:/php/php7/tmp/xdebug/xdebug_remote.log"
xdebug.show_exception_trace=0
xdebug.show_local_vars=9
xdebug.show_mem_delta=0
xdebug.trace_format=0
Still inside php.ini disable output buffering:
output_buffering = OffJust create the folders tmp/xdebug inside your php installation.
Restart your Http Server (IIS, Apache or NGinx)
On the client side, its needed the DBGp Plugin.
You can find a good explanation at:
https://stackoverflow.com/questions/5139469/configure-notepad-dbgp-plugin-and-xdebug-for-php
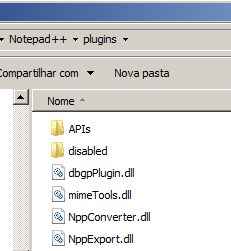
Move dbgpPlugin.dll file to Notepad++ plugins folder
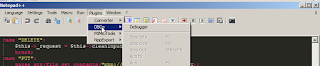
Now open your Notepad++ or restart it, and you should see DBGp option in the Plugins menu.
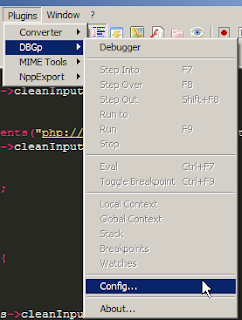
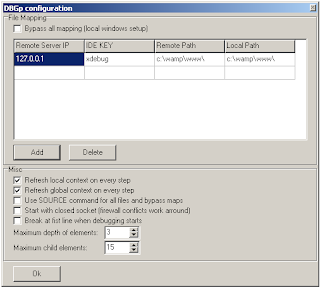
Open Notepad++ go to Plugins->DBGp->Config
Set the Remote Server IP to 127.0.0.1
IDE KEY to xdebug
Remote Path to your web folder
Local Path to your web folder
To start debugging just add “?XDEBUG_SESSION_START=session_name” at end of url.
For example, like this: http://localhost/myweb/users.php?XDEBUG_SESSION_START=test
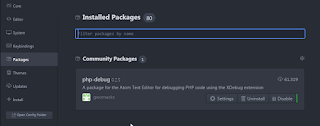
To configure Atom to debug is very easy.
Install the php-debug
Mark a breakpoint
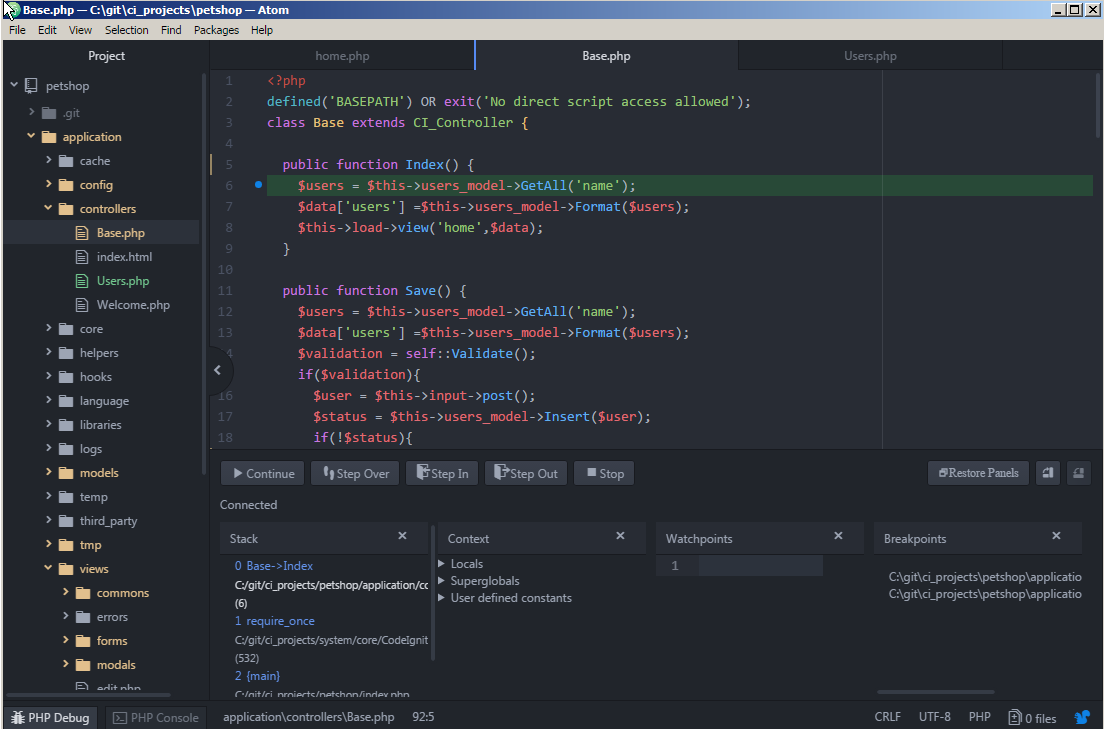
To start debugging just add “?XDEBUG_SESSION_START=session_name” at end of url.
For example, like this: http://localhost/myweb/users.php?XDEBUG_SESSION_START=test
stackoverflow differences thread-safe and non thread safe
https://gist.github.com/odan/1abe76d373a9cbb15bed