The Sysdig Datasource Plugin for Grafana is now open-source!
You can visit the documentation and code at https://github.com/draios/grafana-sysdig-datasource.
This README discusses the installation and configuration instructions for the Sysdig datasource plugin for Grafana.

There are several installation approaches available for the Sysdig datasource plugin.
Note: The Sysdig datasource plugin is currently not included in the official & community built plugin page, and needs to be installed manually.
An easy and flexible way to add the Sysdig datasource plugin to a Grafana container is to create a custom image:
- Download the plugin to the grafana-sysdig directory:
user@host:~$ curl https://download.sysdig.com/stable/grafana-sysdig-datasource/grafana-sysdig-datasource-v0.2.tgz -o sysdig.tgz
user@host:~$ mkdir grafana-sysdig
user@host:~$ tar zxf sysdig.tgz -C grafana-sysdig
user@host:~$ cd grafana-sysdig
- Create a container image Dockerfile:
user@host:grafana-sysdig$ echo "ARG GRAFANA_VERSION=\"latest\"

FROM grafana/grafana:\${GRAFANA_VERSION}

ADD grafana-sysdig /var/lib/grafana/plugins/sysdig
" > Dockerfile
- Build the image:
user@host:grafana-sysdig$ docker build -t grafana-sysdig .
- Run the image:
user@host:grafana-sysdig$ docker run -d -p 3000:3000 --name grafana grafana-sysdig
Note: For more information, refer to the Grafana installation using Docker page.
Alternatively, the default Grafana container image can be used as is, and the plugin directory can be mounted on the host to make it available in the container:
- Prepare the Grafana data directory and download the plugin:
user@host:~$ mkdir grafana-data
user@host:~$ mkdir grafana-data/plugins
user@host:~$ curl https://download.sysdig.com/stable/grafana-sysdig-datasource/grafana-sysdig-datasource-v0.2.tgz -o sysdig.tgz
user@host:~$ tar zxf sysdig.tgz -C grafana-data/plugins
- Start the container with the current user, to give read/write permissions to the data directory:
user@host:~$ ID=$(id -u)
user@host:~$ docker run -d --user $ID --volume "$PWD/grafana-data:/var/lib/grafana" -p 3000:3000 grafana/grafana:latest
Note: For more information, refer to the Grafana installation documentation and the Docker documentation.
The plugin can be installed on any host where Grafana is installed. To install the plugin:
- Open a shell terminal.
- Run the series of commands below:
user@host:~$ curl https://download.sysdig.com/stable/grafana-sysdig-datasource/grafana-sysdig-datasource-v0.2.tgz -o sysdig.tgz
user@host:~$ tar zxf sysdig.tgz
user@host:~$ sudo cp -R sysdig /var/lib/grafana/plugins
user@host:~$ sudo service grafana-server restart
Note: Grafana plugins are installed in
/usr/share/grafana/plugins. However, the Sysdig plugin must be installed in/var/lib/grafana/pluginsinstead.
- Open a shell terminal.
- Run the series of commands below:
user@host:~$ curl https://download.sysdig.com/stable/grafana-sysdig-datasource/grafana-sysdig-datasource-v0.2.tgz -o sysdig.tgz
user@host:~$ tar zxf sysdig.tgz
user@host:~$ cp -R sysdig /usr/local/var/lib/grafana/plugins
user@host:~$ brew services restart grafana
Note: For more information, refer to the Grafana installation on Mac documentation.
- Download the plugin from: https://download.sysdig.com/stable/grafana-sysdig-datasource/grafana-sysdig-datasource-v0.2.zip
- Install the plugin in the Grafana plugins folder.
- Restart Grafana.
Note: For more information, refer to the Grafana installation on Windows documentation.
To add a datasource to Grafana:
- Open Grafana.
- On the Datasources tab, click the Add Data Sources button.
- Define a name for the datasource.
- Open the Type dropdown menu, and select Sysdig.
- Open the Plan dropdown menu, and select either Basic/Pro Cloud for Sysdig SaaS or Pro Software for on-premises installations.
- Open the Sysdig UI, and navigate to Settings -> User Profile -> Sysdig Monitor API token.
- Copy the API token, and paste it into the API Token field in Grafana.

After creating the datasource, Sysdig Monitor dashboards can then be imported into Grafana:
- On the Datasources tab, select the Sysdig datasource.
- Click the Import button for dashboards.
- Navigate to the Dashboards home page, and pull down the dashboard selection to see all the dashboards available.

Custom panels can be added once the Sysdig datasource is installed. Any panel supported by Grafana can be used.
Note: For more information, refer to the Grafana documentation website.
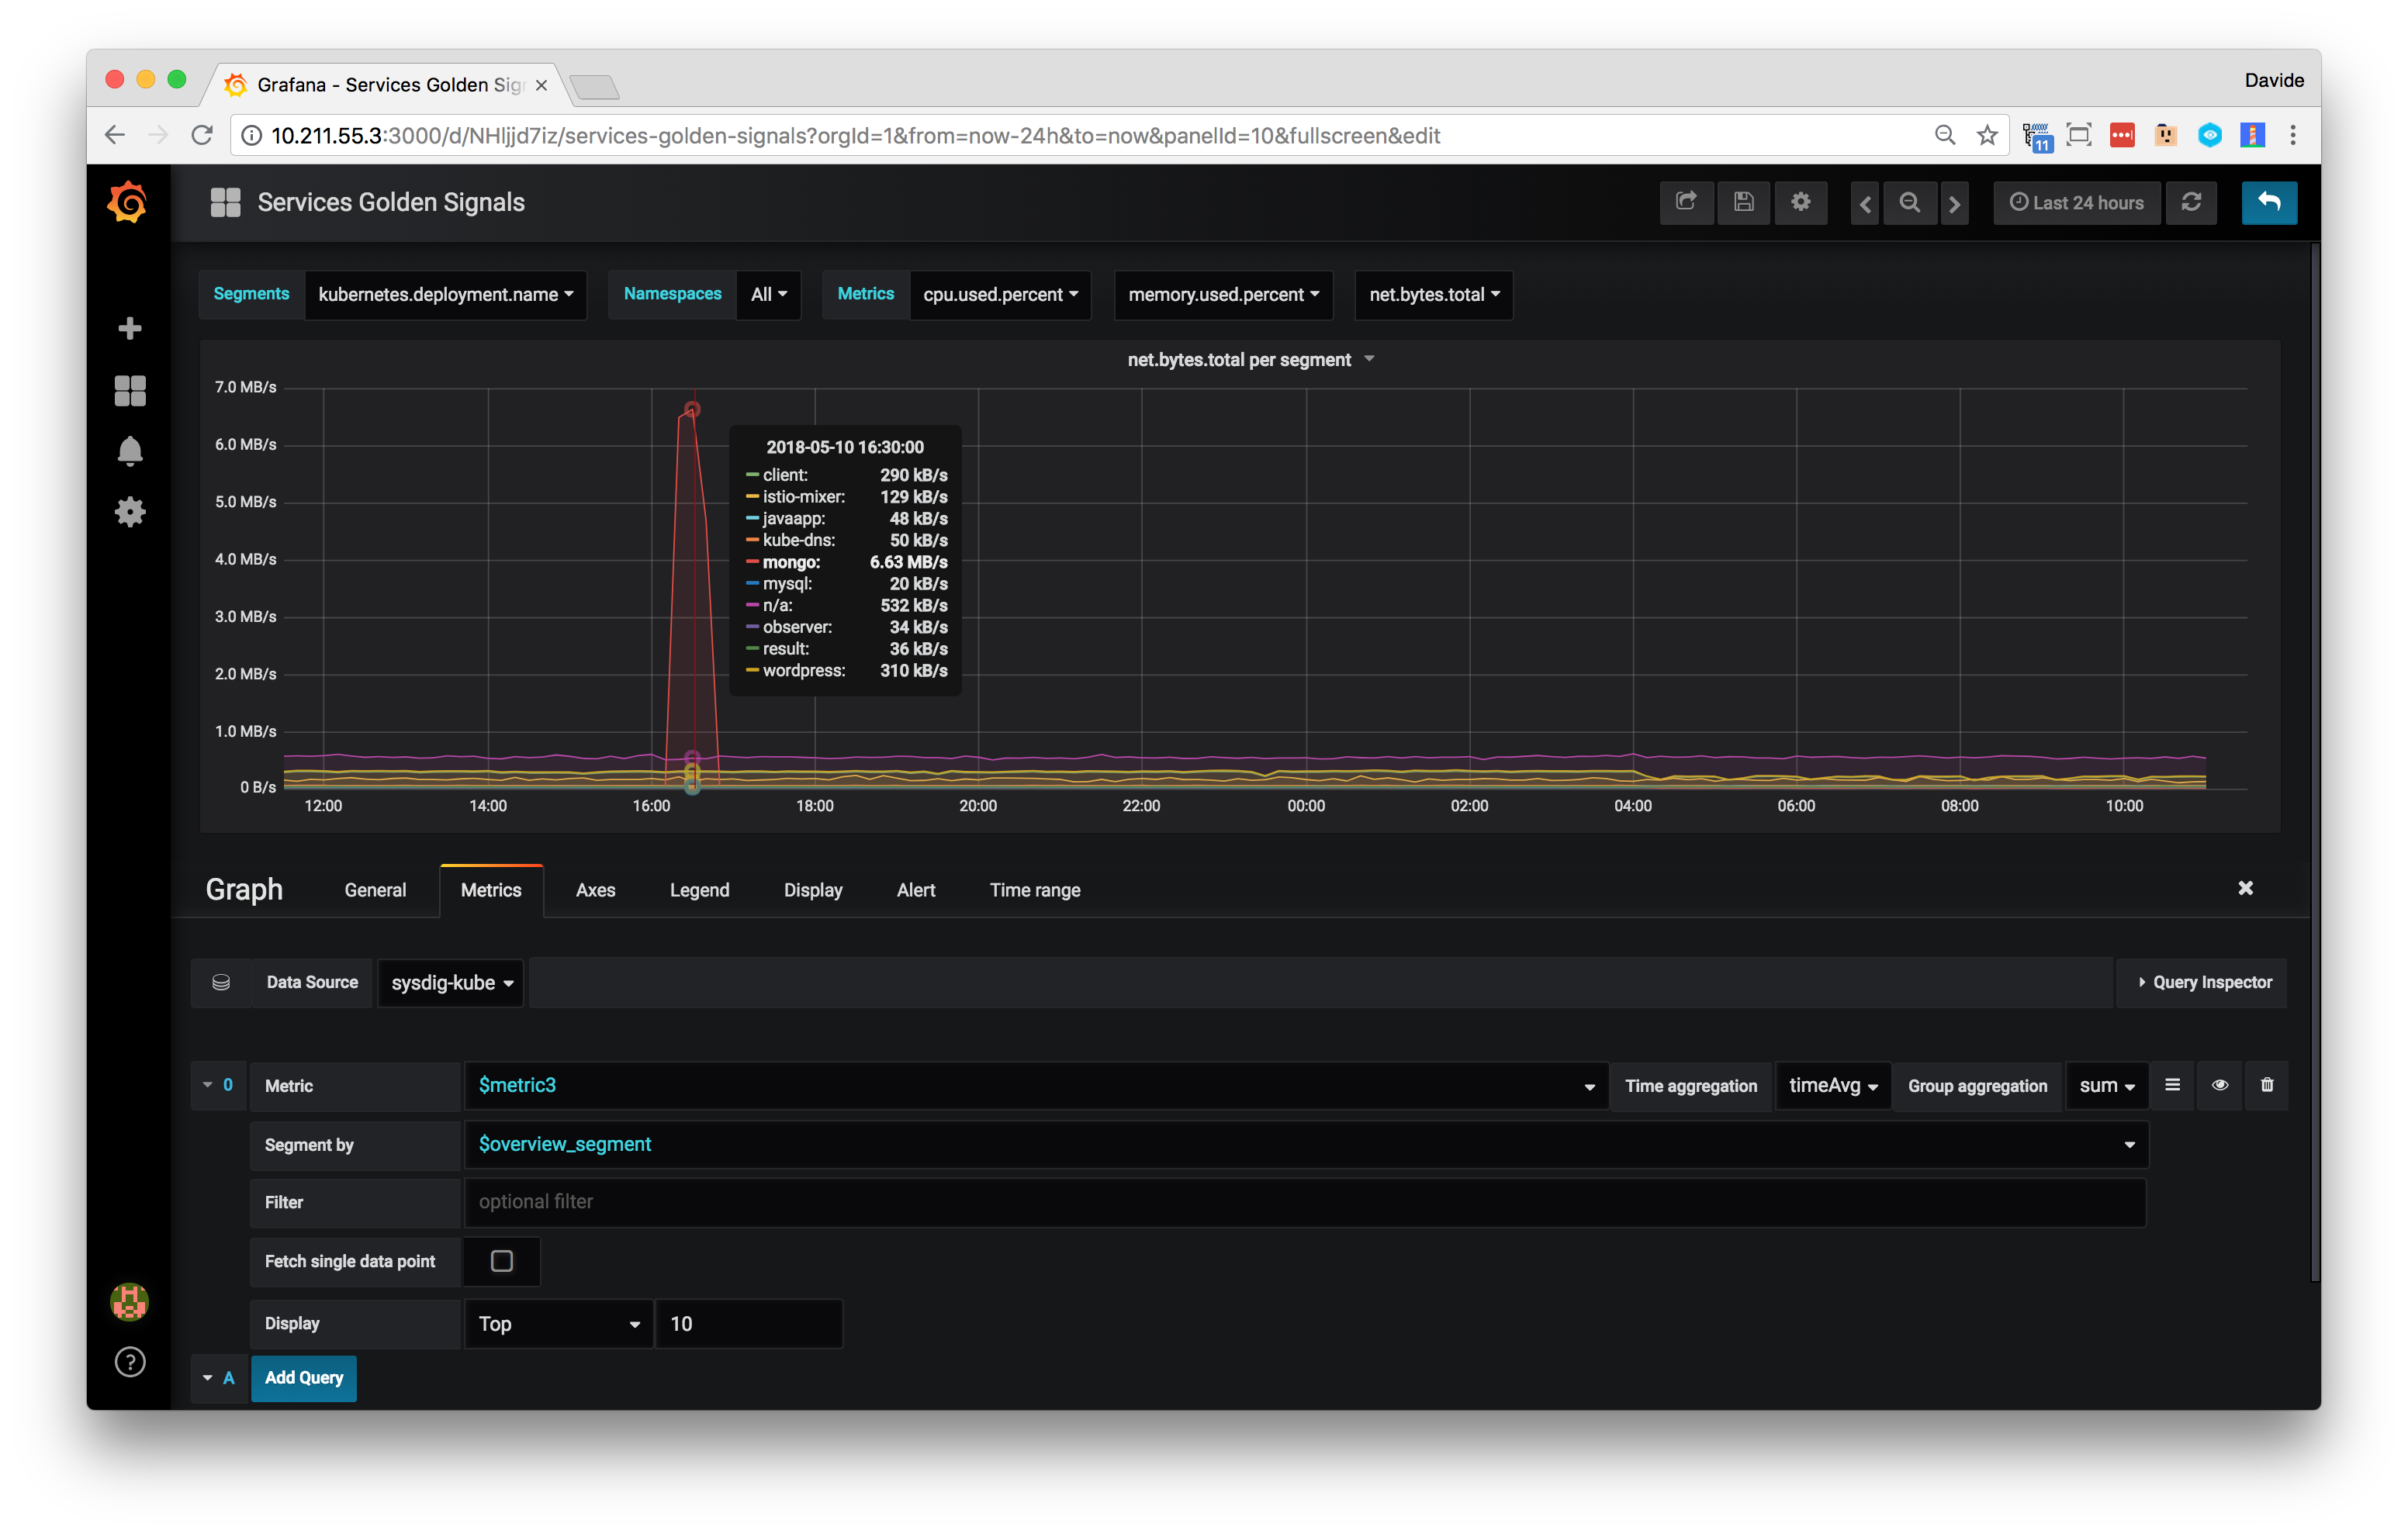
In Sysdig, number panels, bar charts and histograms display aggregated data (i.e. a single data point across the entire time window). By default, Grafana loads time series and then applies an additional aggregation to data points to calculate a single value (displayed in the Singlestat panel for instance).
Note: To maintain the same aggregation mechanism and precision offered by the Sysdig API, create panels with the "Fetch single data point" flag turned on. This will instruct the datasource to make an aggregated data request to the API.
A panel can be configured with an optional filter to fetch data for a subset of the infrastructure or only for a given label.
The filter is a string, and should follow the Sysdig filtering language syntax:
- The syntax of an expression is
label_name operator "label_value"(double-quotes are mandatory) - Expressions can be combined with the boolean operators and/or (
expression and expression or expression) - The following operators are supported:
=and!=(e.g.name = "value"orname != "value")containsandnot ... contains(e.g.name contains "value"ornot name contains "value")inandnot... in(e.g.name in ("value-1", "value-2")ornot name in ("value-1", "value-2"))
- Valid label names are essentially the ones used for the segmentation (use the Segment by dropdown to review what is needed).
Some examples:
host.hostName = "ip-1-2-3-4"cloudProvider.availabilityZone = "us-east-2b" and container.name = "boring_sinoussi"(wherecloudProvider.*are labels coming from AWS)kubernetes.namespace.name = "java-app" and kubernetes.deployment.name in ("cassandra", "redis")
The Sysdig datasource plugin supports variables, allowing for dynamic and interactive dashboards to be created.
Note: Sysdig recommends reviewing the Grafana Variables documentation for use cases, examples, and more.
Variables can be used to configure three properties of a dashboard panel:
- Metric: Select the metric name to use for the panel.
- Segmentation (Segment by field): Select the label name to segment data.
- Filter: Select either a label name or one (or more) label values.
The following list shows how variables can be configured:
- Query, custom, and constant variable types are supported
- The query for a metric name can use the function
metrics(pattern)that returns a list of metrics matching the specificpatternregex - The query for a label name can use the function
label_names(pattern)that returns a list of label names matching the specificpatternregex - The query for a label value can use the function
label_values(label_name)that returns a list of label values for the specified label name - metric name and label name variables cannot have multi-value or include all option properties enabled
- A label value can be configured with multi-value and/or include all option properties enabled only with
inandnot ... inoperators
Variables can be created to identify a metric name, and then use it to configure a panel with a dynamic metric.
A couple of notes about variables for metric names:
- Query, Custom, or Constant variables can be used.
Note: Please note that the Multi-value and Include All options must be disabled.
- Query variables can use the
metrics(pattern)function, that returns a list of metrics matching the specificpatternregex.

Label names are used for panel segmentations (Segment by field) and filters.
A couple of notes about variables for label names:
- Query, Custom, or Constant variables can be used.
Note: Please note that the Multi-value and Include All options must be disabled.
- Query variables can use the
label_names(pattern)function, that returns a list of label names matching the specificpatternregex.


Label values are used in filters to identify a subset of the infrastructure or data in general, allowing users to create a row per service, or use a single dashboard to analyze all available applications.
Some notes about variables for label values:
- You can use a Query, Custom, or Constant variables.
- Query variables can use the
label_values(label_name)function, that returns a list of label values for the specified label name. - Multi-value variables, or variables with the Include All option enabled can only be used with
inandnot ... inoperators. - Variables must not be enclosed by quotes.
Note: The final string will contain quotes when needed (e.g.
$name = $valuewill be resolved tometric = "foo").


The complete example below contains dynamic rows and panels:

The Sysdig datasource is currently in Beta. Sysdig will continue to release iterations to make the datasource more complete and robust; however, some issues may be encountered. A list of known limitations is provided below:
- The datasource has only been tested with Grafana 4.6 and the latest release (5.1). If you're using other versions of Grafana, we'll be happy to add it to the testing suite!
- We leverage annotations to show Sysdig events, but we don't support it just yet.
- Topology panels are not supported in Grafana, so importing Sysdig dashboards will ignore these panels.
- With Grafana you can enter any arbitrary time range, but data will be fetched according to retention and granularity restrictions as explained in this Sysdig Support page.
- Grafana doesn't support exponential y-axis scale (the import from Sysdig will fallback to linear scale).
The Sysdig Datasource Plugin for Grafana is currently in beta. We'd love to hear from you and help you with it!
Join our Public Slack channel (#grafana) for announcements and discussions.