Skip to content

Instantly share code, notes, and snippets.

@dliappis
Last active March 1, 2019 08:09
Show Gist options
  • Save dliappis/2e61295744d7e2f95a63394d771a86d4 to your computer and use it in GitHub Desktop.
Save dliappis/2e61295744d7e2f95a63394d771a86d4 to your computer and use it in GitHub Desktop.
CCR Recovery from Remote Benchmark plan

Purpose

Benchmark recovery from remote

Environment

We will use the existing workflow in: https://github.com/dliappis/stack-terraform/tree/ccr/projects/ccr

  • ES: 3 node clusters, security enabled
  • GCP: ES: custom-16-32768 16cpu / 32GB ram / min Skylake processor, Loaddriver: n1-standard-16 (16vcpu 60GB ram)
  • AWS: ES: c5d.4xlarge 16vcpu / 32GB ram, Loaddriver: m5d.4xlarge (16vcpu 64GB ram)
  • Locations:
    • AWS: Leader: eu-central-1 (Frankfurt) Follower: us-east-2 (Ohio)
    • GCP: Leader: eu-west-2 (Netherlands) Follower: us-central-1 (Iowa)
  • Index settings: 3P/1R
  • Rally tracks: geopoint / http_logs / pmc. Index settings (unless specifically changed): 3P/1R
  • OS: Ubuntu 16.04 4.4.0-1061-aws
  • Java version (unless specifically changed): OpenJDK 8 1.8.0_191

Collected metrics

  • metricbeat from each node (metricbeat enabled everywhere)
  • recovery-stats (from _recovery) every 1s
  • from some experiments: node-stats only for jvm/mem to provide heap usage and gc insights
  • median indexing throughput and the usual results Rally provides in the summary

Criteria to compare runs:

  • time taken to follower to complete recovery
  • indexing throughput
  • overall system usage (CPU, IO, Network)
  • remote tcp compression off vs on
  • Telemetry device collection frequency
    • "recovery-stats-sample-interval": 1

Benchmark combinations

Experiment 1: AWS, fully index corpora, initiate recovery, no tcp remote compression

Tracks: geopoint, http_logs, pmc Challenge: new challenge (to be created) executing in the following order: 1. Delete and create indices on leader 2. Index entire corpora 8 indexing clients using max performance (no target-throoughput set) and then stop (don't index any more) 3. Join follower, start recovery 4. Consider benchmark over when follower has recovered completely

Experiment 2: same as experiment 1, enabled remote tcp compression

Tracks: geopoint, http_logs, pmc Challenge: new challenge (to be created) executing in the following order: 1. Delete and create indices on leader 2. Index entire corpora 8 indexing clients using max performance (no target-throoughput set) and then stop (don't index any more) 3. Join follower, start recovery 4. Consider benchmark over when follower has recovered completely

Experiment 3: AWS, fully index corpora, initiate recovery, keep indexing at lower performance during recovery, remote tcp compression off

Tracks: geopoint, http_logs, pmc Challenge: new challenge (to be created) executing in the following order: 1. Delete and create indices on leader 2. Index some % of corpora, 8 indexing clients max performance (no target-throughput set) 3. Join follower, start recovery and keep indexing on leader at a lower throughput 4. Consider benchmark over when follower has recovered completely
Experiment 4: same as experiment 3, enabled remote tcp compression

Tracks: geopoint, http_logs, pmc Challenge: new challenge (to be created) executing in the following order: 1. Delete and create indices on leader 2. Index some % of corpora, 8 indexing clients max performance (no target-throughput set) 3. Join follower, start recovery and keep indexing on leader at a lower throughput 4. Consider benchmark over when follower has recovered completely

@dliappis
Copy link
Author

dliappis commented Feb 14, 2019

Experiment 1 results

All experiments included:

Conclusions:

  • Parallel recovery is essential for achieving good recovery from remote performance.
  • 1MB chunk size, 5 max concurrent file chunks (using smart file chunk fetching) is a good general default when no tcp compression has been enabled.

Detailed results per track below.

Geopoint

Indexed corpus with 3 shards, 1 replica:

green open leader tzH5IiTRQEKEGOQTRkuIiQ 3 1 60844404 0 8.3gb 4.9gb

1. Using non-configurable chunk_size: 64KB

Replcation took 3:59:44.90000

2. Using PR for configurable chunk size

Tried with 1MB chunk size and 5MB chunk size with 0 replicas.

Detailed results and graphs in the links above, in summary:

  • 1MB: recovery took: 0:14:04.368000
  • 5MB: recovery took: 0:04:47.406000

3. Using parallel recovery PR

Given the slowness of results in 1. and 2., it became evident the high latency (~100ms) requires parallelization of operations.

Used the PR defaults:

"ccr_recovery_chunk_size": "1MB",
"ccr_recovery_max_concurrent_file_chunks": 5

Results

Recovery from remote took: 0:01:13.300900

http_logs

All benchmarks used 3 primary shards and 0 replicas and targeted the 6.7 Elasticsearch branch.
Indexed corpus:

green open leader1 2ueZ8NwBT0mqWM6SJ-b9ZQ 3 0  12406628 0 633.5mb 633.5mb
green open leader2 Li7jlD5eSc6CR218hKX7Vw 3 0  41417502 0     2gb     2gb
green open leader3 0DevT85aRUut7voO6wh4WA 3 0 193424966 0   9.9gb   9.9gb

Iteration 1: using commit 808db1f

Results

Recovery from remote took: 0:05:53.016000

Network usage:

httplogs_baseline_defaults

JVM Heap usage:

httpslogs_baseline_jvm_heap_usage

GC Usage:

httplogs_baseline_gc_usage

Iteration 2: same commit as iter. 1, double chunk size: 5MB

Results

Recovery from remote took: 0:05:12.449000 (40seconds faster)

Network usage comparison against 1MB chunk size:

httplogs_5mb_vs_1mb_baseline_comparison_network

Iteration 3: using commit 38416aa

Used the changes introduced in PR#38841 for smarter CCR concurrent file fetch.

Used defaults: 1MB chunk size, 5 max concurrent file chunks

Results

Recovery from remote took: 0:03:05.924000, 47.3% drop compared to iteration 1

Network usage comparison against iteration 1:

http_logs_compare_smart_fetch_vs_before_using_defaults

Iteration 4: same commit as iter 3, higher defaults

Used: 5MB chunk size, default max concurrent file chunks: 5

Recovery from remote took: 0:02:40.525000

Network usage comparison against iteration 3:

http_logs_compare_smart_fetch_5mb_vs_1mb_chunk_size

Iteration 5: same commit as iter 3, higher defaults

Used: 1MB chunk size, increased max concurrent file chunks: 10

Recovery from remote took: 0:02:34.672000

Network usage comparison against iteration 3:

http_logs_compare_smart_fetch_5_vs_10_max_concurrent_file_chunks

Iteration 6: same commit as iter 3, even higher defaults

Used: 5MB chunk size, max concurrent file chunks: 8

Recovery from remote took: 0:03:38.003000

Iteration 7: same commit and params as iteration 6, using java-11 with AVX enabled

Used: 5MB chunk size, max concurrent file chunks: 8

Recovery from remote took: 0:02:36.914000

@dliappis
Copy link
Author

dliappis commented Feb 15, 2019

Experiment 2 results

All experiments included:

  • on branch 6.7
  • using commit: 38416aa
  • includingchanges introduced in PR#38841 for smarter CCR concurrent file fetch.
  • 3 primary shards, 0 replicas

http_logs

1. Using defaults 1MB chunk size, 5 max concurrent file chunks

Replication took: 0:03:13.690000

2. Using 5MB chunk size, 8 mac concurrent file chunks

Replication took: 0:02:24.404000

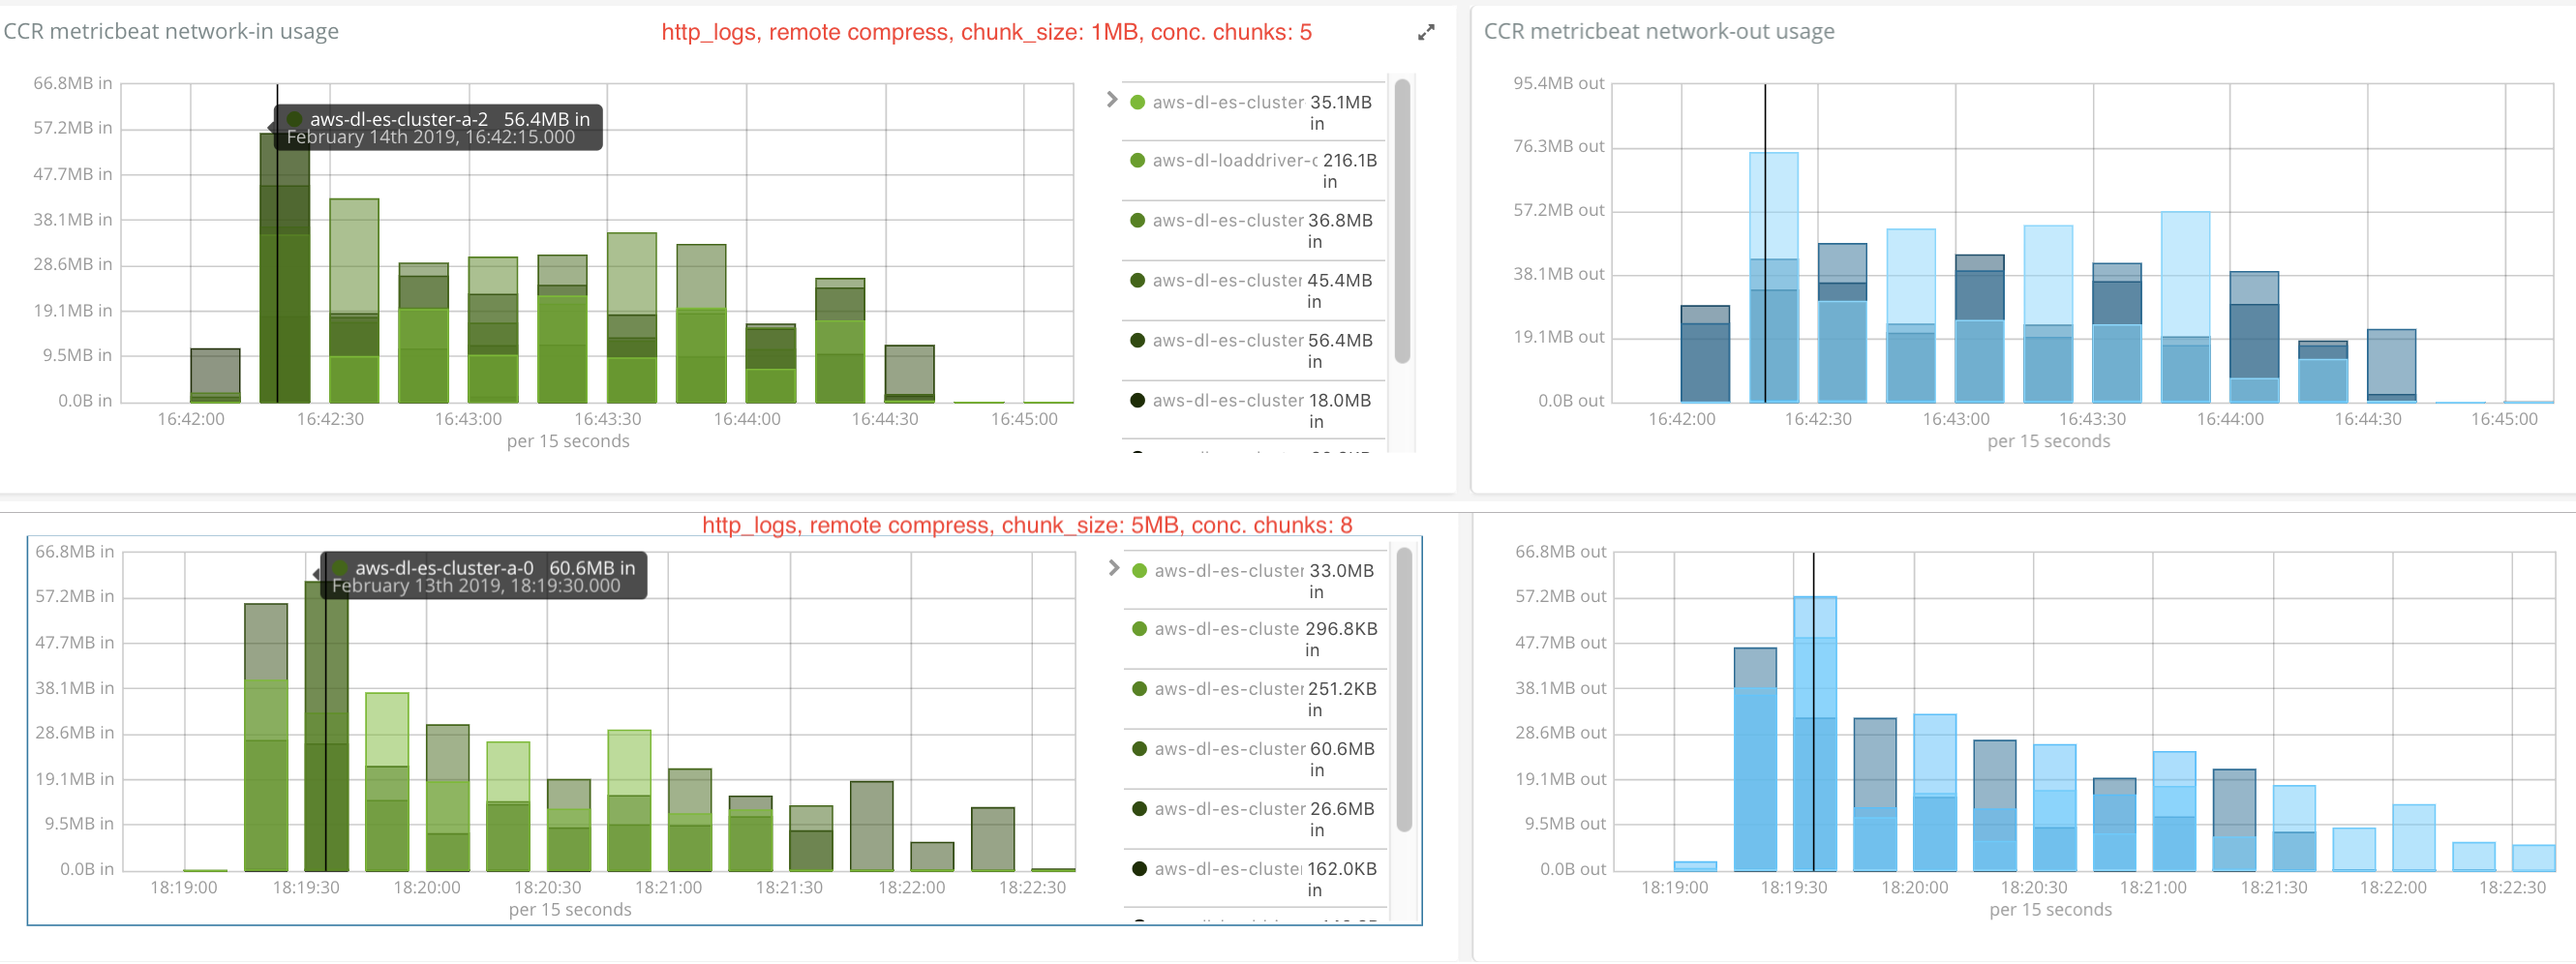
Network usage comparison between iteration 2 and iteration 1:

http_logs_remotecompress_network_usage_1mb_5conc-vs-5mb_8conc

CPU usage comparison between iteration 2 and iteration 1:

http_logs_cpu_usage_remotecompress_1mb_5conc-vs-5mb_8conc

CPU usage comparison between this and same parameters without compression (experiment 1, iteration 6):

http_logs_compare_cpu_user_between_compress_off_on_with_5mb_8parallelchunks

Focusing even further on the first node of the leader cluster (where compression takes place), we see a large difference from 2% peak user cpu usage to 22.3% user cpu usage:

http_logs_compare_user_cpu_cluster_b_0_between_compress_off_on_with_5mb_8parallelchunks

Network comparison between compression off (experiment 1, iteration 6) and compression on

http_logs_compare_network_between_compress_off_on_with_5mb_8parallelchunks

3. same commit and params as in 2., using java-11 with AVX enabled

The idea here is to compare if using java-11 decreases cpu usage when remote compression is enabled.

Conclusion: Using java-11 with AVX enabled didn't show any significant change in cpu usage on the follower, when remote compression is enabled.

Using 5MB chunk size, 8 mac concurrent file chunks

Replication took: 0:02:27.299000

user cpu (all nodes) comparison between remote_compress:off (experiment 1, iter 7) and this one:

http_logs_java11_remote_compress_off_vs_on_5mb_8

same chart, displaying user cpu only for follower node 3

http_logs_java11_cpu_user_follower_2_remote_compress_off_vs_on_5mb_8

compare user cpu between 2. and this (java 8 vs java 11)

http_logs_cpu_use_compare_java11_vs_java8_remote_compress_true_5mb_8conc

network usage comparison remote_compress:off (experiment 1, iter 7) and this one:

http_logs_compare_network_java11_compress_on_vs_off_5mb_8_concurrent

network usage comparison remote_compress:off and this one, focused on first leader node and first follower node

http_logs_per_node_comparison_java11_remote_compress_off_vs_on_5mb_8_chunks

@dliappis
Copy link
Author

dliappis commented Feb 22, 2019

Experiment 3 results (index up to % -> recovery and index slower)

All experiments included:

  • on branch 6.7
  • using commit: 38416aa
  • including changes introduced in PR#38841 for smarter CCR concurrent file fetch.
  • 3 primary shards, 0 replicas

http_logs

  1. Indexed at maximum indexing throughput with 8 clients for 700s with no replication
  2. Joined clusters and initiated recovery from remote 720s after start of benchmark
  3. Reduced indexing throughput at time point 2 to 80000doc/s until the end of the benchmark.

Performance Charts

http_logs_all_usages_corrected

@dliappis
Copy link
Author

dliappis commented Feb 26, 2019

Experiment 5 (Adhoc)

Purpose

Compare remote compression off/on on small nodes with limited CPU power

Configuration

Benchmark using 1 node clusters, 1 shard, using: c5d.xlarge instances:

ES node specs:

  • 4 vcpus
  • 7.5 GB ram
  • 92GB SSD
  • Heap: 3GB

All experiments included:

  • on branch 6.7
  • using commit: 38416aa
  • including changes introduced in PR#38841 for smarter CCR concurrent file fetch.
  • 1 primary shards, 0 replicas
  • 1MB chunk size, 5 max concurrent file chunks

Iteration 1, http_logs, remote_compress: off

recovery took: 0:08:30.843000

http_logs_remote_compress_off

Iteration 2, http_logs, remote_compress: on

recovery took: 0:11:09.063000

http_logs_remote_compress_on

Analysis between iteration 1 / iteration 2 (remote compress off vs on)

  1. CPU user usage: there is a phase of peak when all three indices are getting recovered and then stabilizes when only the remaining large index (leader3) gets recovered.

    remote.compress Peak cpu % (all indices) avg cpu % during indexing of last index
    OFF, leader 21% 5%
    ON, leader 66.18% 19%
    ON, follower 18.5% 5%
    OFF, follower 20.4% 5%
  2. Network usage:

    remote.compress Peak MB/s (all indices) avg MB/s during indexing of last index
    OFF, leader-out 91.6 MB/s 32 MB/s
    ON, leader-out 48.5 MB/s 16 MB/s
    OFF, follower-in 67.2 MB/s 33 MB/s
    ON, follower-in 51.6 MB/s 13 MB/s
  3. Chunk settings (1MB / 5 max concurrent file chunks) aren't large enough to saturate the network and compression ends up being slower.

  4. Recovery with remote compress off took 0:08:30.843000. Recovery compression on took: 0:11:09.063000

Sign up for free to join this conversation on GitHub. Already have an account? Sign in to comment