Earlier today an interesting article about plotting the streets of france appeared in my feed. What Simon does in his blog post is essentially read OSM street-lines-data for France and displays it in what I find to be a rather traditional and elegant way.
The first thing I immediately though of was: "I'd love to see this for Ireland". As an OSX user, it took a few tricks to get the article replicated for Ireland therefore I've decided to share my notes.
Should you wish to replicate this for your country, here are some notes I've taken.
The first thing you'll need to do is get data off the Geofabrik servers. Being my first time transforming data I didn't know where to look, and what to look for.
Firstly, I found out this URL: http://download.geofabrik.de/europe.html which contains links to .osm.pbf', .shp.zip, and osm.zip files.
Not unlike Simon, you'll have to download the .osm.pbf file understanding that you'll have to convert it to an osm-friendly format. The .shp.zip file contained too many dimensions for me to care to learn how it works.
Second step is to unzip, then convert the downloaded pbf file to an o5m file, and finally filter the parts of the osm file you want to work with. Let's see how you do all of that.
After acquiring osmconvert and osmfilter, you'll need to compile them.
For osmconvert, it's as simple as:
$> wget -O - http://m.m.i24.cc/osmconvert.c | cc -x c - -lz -O3 -o osmconvert
And for osmfilter again:
$> wget -O - http://m.m.i24.cc/osmfilter.c |cc -x c - -O3 -o osmfilter
After having compiled osmconvert and osmfilter, you are ready to begin the conversion of the .pbf file to .o5m to .osm.
Using the compiled osmconvert, convert the pbf from o5m like such:
$> ./osmconvert ireland-and-northern-ireland-latest.osm.pbf --out-o5m -o="ireland.o5m"
Now using the second compiled program osmfilter, extract the parts you are interested in (Again, this is directly taken from Simon's article):
./osmfilter ireland.o5m --keep="highway=motorway =motorway_link =trunk
=trunk_link =primary =primary_link =secondary =secondary_link =tertiary
=tertiary_link =living_street =pedestrian =residential =unclassified
=service" --drop-author --drop-version > ireland.osm
Now that you've converted the pbf, and filtered the o5m into a cleaned osm, I needed to transform the osm file into an shp shapefile.
You can get QuantumGIS from http://www.kyngchaos.com/software/qgis. Follow the requirements, and you will be able to open up QuantumGIS.
Before converting your layers to shp files, you will need to enable the OpenStreetMap Plugin in QGIS.
- Top menu, select "Plugins" > "Manage Plugins…",
- From the Manage Plugins windows, search for "Open" and enable the OpenStreetMap core plugin
Now that you've installed the OpenStreetMap plugin, a new "Top Menu" item should have appeared in QuantumGIS. Look for a menu-item named "Web".
From there, you will have multiple choices under the OpenStreetMap option. Select Load OSM from file and select the osm file we've created before.
You're nearly there. Now, on the left-handside, you will see 3 layers: {country}_streets_points, {country}_streets_line, {country}_streets_polygons.
Unselect points, and polygons. Keep only lines.
Now that you've only the lines for your country/region/area, from the top menu, select Layer > Save As and save your shp shape file.
Finally some R...
Now, in order to continue, you will need to make sure the following packages are installed:
- ggplot2
- maptools
- proto
- sp
If you don't have them, you can install them with:
R> install.packages(c('ggplot2', 'maptools', 'proto', 'sp'))
You have all the required packages, your files have been converted into the proper shp format, you are now ready to load the data into something that can be displayed:
shpIreland <- readShapeLines("path/to/shapefile/file.shp")
linesIreland <- conv_sp_lines_to_seg(shpIreland)
rm(shpIreland)

streets <- geom_segment2(data=linesIreland,
                         aes(xend=elon, yend=elat),
                         size=.055,
                         color="black")

p <- ggplot(linesIreland, aes(x=slon,y=slat)) +
    streets +
    scale_x_continuous("", breaks=NULL) +
    scale_y_continuous("", breaks=NULL) +
    labs(title="Streets of Ireland and Northern Ireland 2013") +
    theme(panel.background=element_rect(fill='#f5f4e0')) +
    theme(plot.background=element_rect(fill='#f5f4e0'))
Please note that geom_segment2 and conv_sp_lines_to_seg are respectively third-party functions from Spatial Analysis UK, and Simon Müller. You can find a script attached to this gist that contains all the code.
Here's what the end result with a map that displays the sparse streets of Ireland looks like:
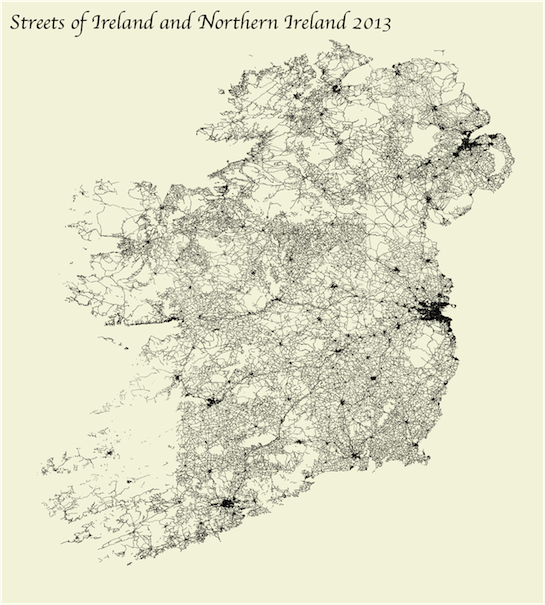
Now, I've saved the plot as a PDF from RStudio, and opened it with Adobe Illustrator which allows me to edit various parts of the plot. That is how the title has been changed. ( That's a pretty big tip right there, write that down )
If you've ever read Edward R. Tufte, you may have come across one of his book called: The Visual Display of Quantitative Information which displays very elegant, Ye Olde Plot types of plots. It is the reason why this map has an edited title, even though I didn't have time to find the proper font so I would agree that it looks slightly sloppy.
If you are interested in the original image, please see the larger image
It's fairly simplistic, and I believe it created what is to be an elegant old-style plot of Ireland's streets (which comprises 2,133,736 street-data points).
Thanks to Simon for his original article.
- See the code in the file called "plotting-full.R" under,
- The data OpenStreetMap-data is published under CC BY-SA-licence