Created
March 20, 2022 17:33
-
-
Save egslava/deab2d53d16c78793f6acc889927adc2 to your computer and use it in GitHub Desktop.
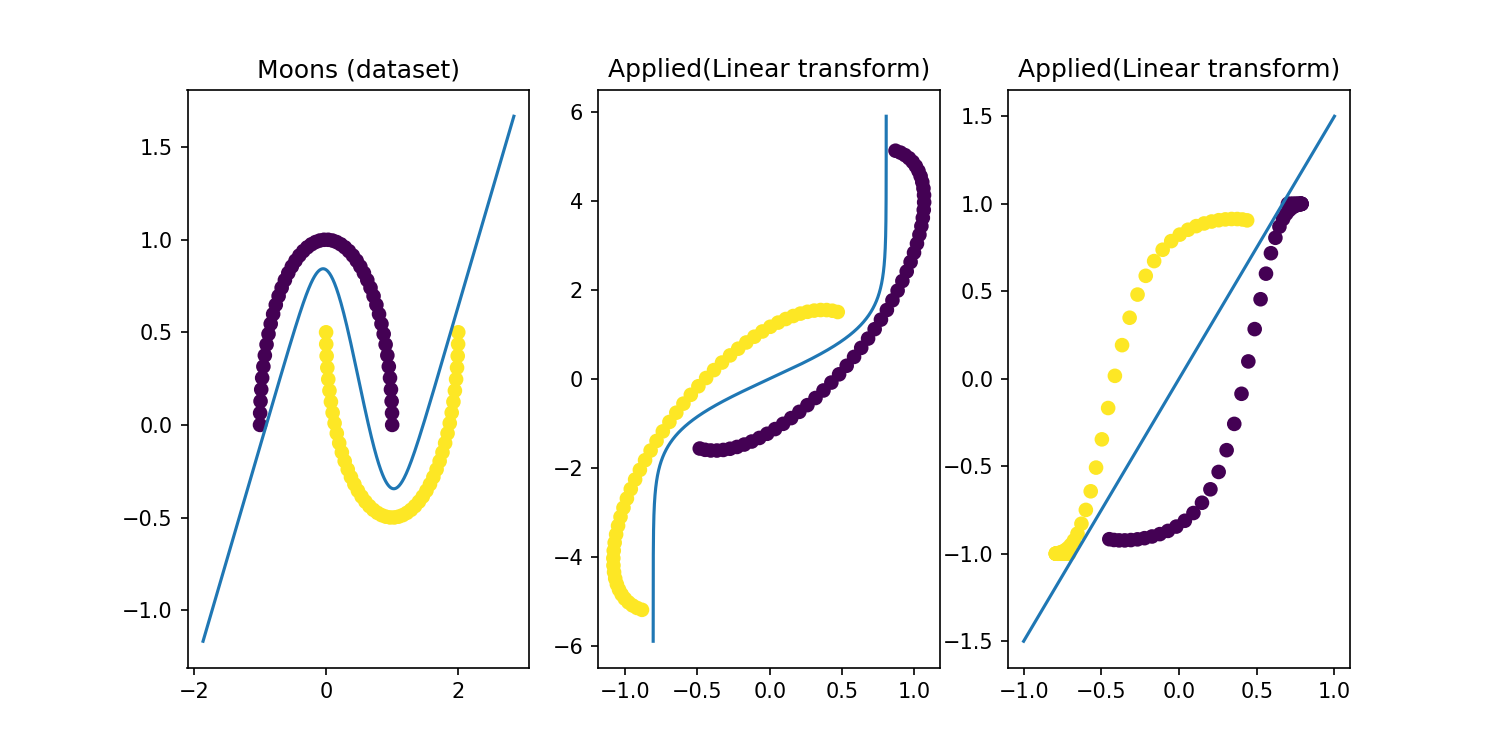
It's enough to have only one mlp layer to classify moons
This file contains bidirectional Unicode text that may be interpreted or compiled differently than what appears below. To review, open the file in an editor that reveals hidden Unicode characters.
Learn more about bidirectional Unicode characters
| from matplotlib.pyplot import * | |
| from numpy import * | |
| from sklearn.datasets import make_moons | |
| # def plot_line(k=3, b=0, label=None, ax=None): | |
| # def pred(x, y, k, b): | |
| # y_pred = k * x + b | |
| # return 1 / (1 + exp((y - y_pred) * 10)) | |
| # | |
| # x, y = meshgrid(linspace(-1, 1), linspace(-1, 1)) | |
| # | |
| # ax = ax or gca() | |
| # ax.pcolormesh(x, y, pred(x, y, k, b), label=label) | |
| T = array([ | |
| [-0.676, -3.347], | |
| [0.554, -0.557], | |
| ]) | |
| bias = array([0.193, 1.778]) | |
| figure(figsize=(10, 5), dpi=150) | |
| subplot(1, 3, 1, title='Moons (dataset)') | |
| Xy, c = make_moons() | |
| scatter(*Xy.T, c=c) | |
| line = linspace(-40, 40, 100_000_000) * 0.05 | |
| plot(*((arctanh(stack([line, line * 1.5]).T)-bias)@ linalg.inv(T)).T) | |
| subplot(1, 3, 2, title='Applied(Linear transform)') | |
| # 1. Linear | |
| scatter(*(Xy @ T + bias).T, c=c) | |
| line = linspace(-1, 1, 100000) + 0.001 | |
| plot(*(arctanh(stack([line, line * 1.5]).T)).T) | |
| subplot(1, 3, 3, title='Applied(Linear transform)') | |
| scatter(*(tanh(Xy @ T + bias)).T, c=c) | |
| line = linspace(-1, 1) | |
| plot(*stack([line, line * 1.5])) | |
| # | |
| # subplot(1, 4, 4, title='Applied(Linear transform)') | |
| # # plot_line(1.5, 0, trans=lambda x: ) | |
| # plot(line, line * 1.5) | |
| # scatter(*(tanh(Xy @ T + bias)).T, c=c) | |
| show() |
Sign up for free
to join this conversation on GitHub.
Already have an account?
Sign in to comment
The output: