By Federica Trevisan ☀️
Hey there! I'm Federica, recent master's graduate in Data Science and participant of the Google Summer of Code '21. During the summer I worked with Wellcome Trust, which comes under the Open Bioinformatics Foundation, on the project entitled Developing WellcomeML further for the visualisation of academic research data under the guidance of my mentors: Antonio Campello, Elizabeth Gallagher and Jeff Uren. This is the final report regarding the past three months of GSoC summer.
WellcomeML is a python package containing a set of utility functions that use machine learning for reading, processing, embedding and classifying academic text data like publications, grants, and other documents. The need for developing a new feature for expanding WellcomeML with further visualisation modules has emerged; in this specific case the objective is to create a standard interactive visualisation tool for the results of the clustering algorithm present in the library. In other words, the main objective is to overcome the issue that for every project an ad-hoc visualisation is built from scratch. And this is reached by standardising the visualisation task, creating an abstract module that allows to visualise the results interactively.
For the tasks organization it has been decided to use a phased approach, starting with the main epic as a "user story" from which two separate phases are derived, each one with smaller tickets for every specific task. For keeping track of the deliverables it has been created a Kanban Board.
- Main epic: Create standard interactive
wellcomeml.vizclass to outputs of wellcomeml.ml.clustering #221 - Phase 1: Build a method to make interactive plots from results of
welcomeml.ml.TextClustering#293 - Phase 2: Styling clustering plot #294
- Extras: Small and well-defined enhancement tasks that can be tackled after GSoC (Hacktoberfest etc.) #352
Since WellcomeML is mostly developed on UNIX/UNIX-based systems, installing and running on Windows is not as straightforward as expected. During the talk-with-mentors period before the proposal submission I already encountered an issue when running the WellcomeML library on my Windows laptop, that has been fixed in the issue #257 and documented in this blog post.
Due to the implementation of the visualize_clusters function consistently evolving, breaking it up into multiple PRs wouldn't have been that effective. Therefore all the changes are included in separate branch Feature/visualisation.
Once the PR gets merged, the visualize_clusters function should be available in the following release of WellcomeML.
Regarding the code, the programming languages that have been used are Python, the viz library Bokeh and Javascript for the interaction.
- https://github.com/wellcometrust/WellcomeML/pull/332/commits
- Contributor graph (available after the PR merge)
Phase 1: Build a method to make interactive plots from results of welcomeml.ml.TextClustering #293
| Issue | Description |
|---|---|
| #303 | Investigate and decide on different packages for the task: e.g. streamlit.io, pyvis, bokeh. |
| #305 | Build a first pass wellcomeml.viz.visualise_clusters.py and auxiliary methods with basic point plotting capability |
| #321 | Allow the class to receive a list of objects, so we can visualise multiple clustering results, for different parameters |
| #309 | Add interactive to cluster plots, so I can hover over points and show some information about the points (e.g. text, points, cluster info) |
| #326 | Add tests Add tests to visualize_clusters.py |
| #325 | Add example with EPMC Pubs dataset. Add example with EPMC Pubs datasets |
Phase 2: Styling clustering plot #294
| Issue | Description |
|---|---|
| #338 | Starting with Wellcome Trust colours as the "default" palette, make standard colours for wellcomeml.viz.visualise_clusters.py plots (or other auxiliary methods) |
| #343 | Option to override default colours to any user-defined list |
| #339 | Add a colour legend (if number of clusters is not too big). |
| #344 | Add filter by a variable (i.e. only show clusters that correspond to a certain variable) |
Visual output:

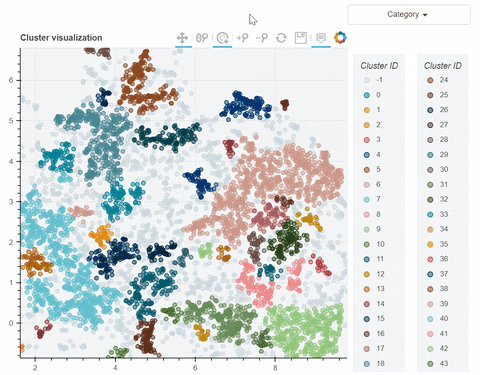
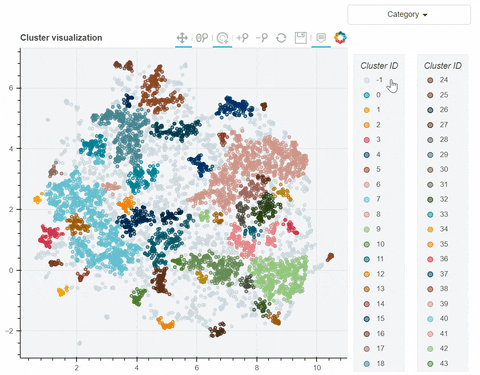
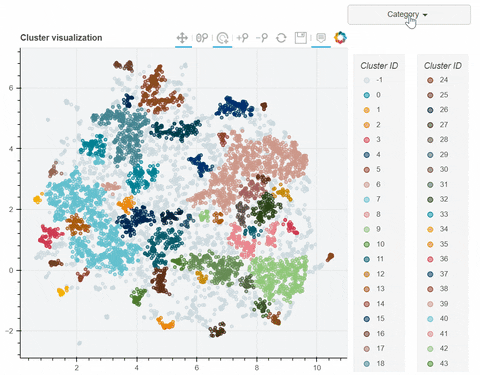
In the following link there's a detailed description of a step-by-step demo of the visualize_clusters function.
Summing up, GSoC with WellcomeML has been a great learning experience and I recommend it to anyone in this field. With the project, I had the opportunity to bring a standardized visualization feature in WellcomeML, a concrete new feature for an active library and that makes me really proud. By being a Windows user and testing the library locally, I have been able to expand WellcomeML frontier by finding some bugs and collaborating with the software engineers in making WellcomeML easy accessible to users running it from other operating systems.
I also gained acquaintance with the Open Source world (branches, PRs, commits, receive/give code reviews) and I plan to keep contributing in OS. I will definitely continue being a part of the OBF and WellcomeML community.
I thank my mentors, the WellcomeML and the OBF team, especially my mentor Antonio Campello for guiding me throughout the project. Thank you for your time in reading this report.
Federica Trevisan