Skip to content

Instantly share code, notes, and snippets.

@gizmaa
Last active April 12, 2024 14:18
Show Gist options
  • Save gizmaa/7214002 to your computer and use it in GitHub Desktop.
Save gizmaa/7214002 to your computer and use it in GitHub Desktop.
Various Julia plotting examples using PyPlot

Plotting

Last Update: May 13, 2019
Offline Version

Contents

PyPlot

Translating

Translating PyPlot code from Python to Julia can be difficult so here are a few examples comparing Python code with its Julia equivalent.

# Python
ax.set_ylim([-30, 10])
ax.spines['right'].set_color('none')
ax.spines['top'].set_color('none')

Source: Axis Boundary Color

# Julia
ax.set_ylim([-30,10])
ax.spines["top"].set_color("none") # Remove the top axis boundary
ax.spines["right"].set_color("none") # Remove the right axis boundary

The above example looked at settings of plot components. The next example will call matplotlib itself.

# Python
from matplotlib.dates import MonthLocator, WeekdayLocator, DateFormatter
majorformatter = DateFormatter("%d.%m.%Y")
minorformatter = DateFormatter("%H:%M")
majorlocator = DayLocator(interval=1)
minorlocator = HourLocator(byhour=(8,16)) # Not sure about this one

Source: Modified from this forum post by Nat Wilson and this matplotlib example.

# Julia
majorformatter = matplotlib.dates.DateFormatter("%d.%m.%Y")
minorformatter = matplotlib.dates.DateFormatter("%H:%M")
majorlocator = matplotlib.dates.DayLocator(interval=1)
minorlocator = matplotlib.dates.HourLocator(byhour=(8, 16))

# After an axis exists
ax1.xaxis.set_major_formatter(majorformatter)
ax1.xaxis.set_minor_formatter(minorformatter)
ax1.xaxis.set_major_locator(majorlocator)
ax1.xaxis.set_minor_locator(minorlocator)

Important Note

The easiest way of doing a quick plot is to simply type it into the REPL (command line) but by default interactive mode might be "off". This means that when you create a figure, figure(), nothing will appear except for the object type in the REPL, PyPlot.Figure(PyObject .... The command plt[:show]() will make the figure visible but also make the REPL temporarily unusable until all figures are closed.

Changing interactive mode to "on" is as simple as running ion(). Plots will be visible and the REPL will still be usable. It will only last for the current session though. Add it to the .juliarc.jl file to make it "on" by default. It can also be turned "off" by running ioff(). If IJulia fails to plot inline try adding gcf() after the plot.

Depending on the editor you are using this may be undesirable. In one mode IJulia may plot inline whereas the other may plot to a window.


Basic Plot

Most of the basic commands in PyPlot are very similar to Matlab.

p = plot(x,y)
xlabel("X")
ylabel("Y")
PyPlot.title("Your Title Goes Here")
grid("on")

The first noticable change is in the plotting command when non-default values are used.

p = plot_date(x,y,linestyle="-",marker="None",label="Base Plot") # Basic line plot

Instead of "linestyle","-" it uses linestyle="-" for parameters.


Plot Annotation

(IJulia, Code)

Annotation Examples

The following command will point an arrow at a point and label the arrow.

annotate("Look, data!",
	xy=[x;y,# Arrow tip
	xytext=[x+dx;y+dy], # Text offset from tip
	xycoords="data", # Coordinates in in "data" units
	arrowprops=["facecolor"=>"black"]) # Julia dictionary objects are automatically converted to Python object when they pass into a PyPlot function

It's important to note that in Python the arrowprops would look like this: arrowprops=dict(arrowstyle="->"). Dictionary definitions look like arrowprops=["facecolor"=>"black"] in Julia.

LaTeX can be used by putting an L in front of LaTeX code, L"$\int x = \frac{x^2}{2} + C$".

annotate(L"$\int x = \frac{x^2}{2} + C$",
	xy=[1;0],
	xycoords="axes fraction",
	xytext=[-10,10],
	textcoords="offset points",
	fontsize=30.0,
	ha="right",
	va="bottom")

Time Customization

(IJulia,Code)

The formatting preparation is accomplished by calling the formatters within Matplotlib.

majorformatter = matplotlib.dates.DateFormatter("%d.%m.%Y")
minorformatter = matplotlib.dates.DateFormatter("%H:%M")
majorlocator = matplotlib.dates.DayLocator(interval=1)
minorlocator = matplotlib.dates.HourLocator(byhour=(8, 16))

They are then applied to the specific axis, the handle of which is called ax1 in this case.

ax1.xaxis.set_major_formatter(majorformatter)
ax1.xaxis.set_minor_formatter(minorformatter)
ax1.xaxis.set_major_locator(majorlocator)
ax1.xaxis.set_minor_locator(minorlocator)

Custom Time


Subplots

(IJulia, Code)

subplot(YXN), Y = number of columns, X = number of rows, N = number of axis being created

The number, N, of a grid of axes starts in the upper left (1), and goes right then down. The second axis of a 2x2 grid is the upper right axis.

subplot(313) # Create the third plot of a 3x1 group of subplots

suptitle("3x1 Subplot") # Supe title, title for all subplots combined

2x2 Subplot

3x1 Subplot

3x1 Touching Subplots


Polar and Windrose Plot

(IJulia, Code)

ax = axes(polar="true") # Create a polar axis
# Do your plotting

# Optional changes
ax.set_thetagrids(collect(0:dtheta:360-dtheta)) # Show grid lines from 0 to 360 in increments of dtheta
ax.set_theta_zero_location("N") # Set 0 degrees to the top of the plot
ax.set_theta_direction(-1) # Switch to clockwise
fig.canvas.draw() # Update the figure

Wind Rose - Bar Plot

Wind Rose - Line Plot


Histogram

(IJulia, Code)

h = plt.hist(x,nbins) # Histogram, PyPlot.plt required to differentiate with conflicting hist command

Histogram


Bar Plot

(IJulia, Code)

b = bar(x,y,color="#0f87bf",align="center",alpha=0.4)
b = barh(x,y,color="#0f87bf",align="center",alpha=0.4)

Bar Plots


Errorbar Plot

(IJulia, Code)

errorbar(x, # Original x data points, N values
	y, # Original y data points, N values
	yerr=errs, # Plus/minus error ranges, Nx2 values
	fmt="o") # Format

Erro Bar Plot


Inexact Plot

(IJulia, Code)

The IJulia example does not properly apply all the formatting as the terminal version does.

xkcd() # Set to XKCD mode, based on the comic (hand drawn)
# Plot everything

Inexact XKCD Plot


Pie Chart

(IJulia, Code)

p = pie(sizes,labels=labels,shadow=true,startangle=90,explode=explode,colors=colors,autopct="%1.1f%%",textprops=font)

Pie Chart


Scatter Plot

(IJulia, Code)

scatter(x,y,s=areas,alpha=0.5)

Scatter Plot


Box Plot

(IJulia, Code)

boxplot(data, # Each column/cell is one box
	notch=true, # Notched center
	whis=0.75, # Whisker length as a percent of inner quartile range
	widths=0.25, # Width of boxes
	vert=false, # Horizontal boxes
	sym="rs") # Symbol color and shape (rs = red square)

Box Plot


Major and Minor Ticks

(IJulia, Code)

###########################
#  Set the tick interval  #
###########################
Mx = matplotlib.ticker.MultipleLocator(20) # Define interval of major ticks
f = matplotlib.ticker.FormatStrFormatter("%1.2f") # Define format of tick labels
ax.xaxis.set_major_locator(Mx) # Set interval of major ticks
ax.xaxis.set_major_formatter(f) # Set format of tick labels

mx = matplotlib.ticker.MultipleLocator(5) # Define interval of minor ticks
ax.xaxis.set_minor_locator(mx) # Set interval of minor ticks

My = matplotlib.ticker.MultipleLocator(0.5) # Define interval of major ticks
ax.yaxis.set_major_locator(My) # Set interval of major ticks

my = matplotlib.ticker.MultipleLocator(0.1) # Define interval of minor ticks
ax.yaxis.set_minor_locator(my) # Set interval of minor ticks

#########################
#  Set tick dimensions  #
#########################
ax.xaxis.set_tick_params(which="major",length=10,width=2,labelsize=16)
ax.xaxis.set_tick_params(which="minor",length=5,width=2)

fig.canvas.draw() # Update the figure

Major and Minor Ticks


Multi-axis Plot

(IJulia, Code)

################
#  Other Axes  #
################
new_position = [0.06;0.06;0.77;0.91] # Position Method 2
ax.set_position(new_position) # Position Method 2: Change the size and position of the axis
#fig.subplots_adjust(right=0.85) # Position Method 1

ax2 = ax.twinx() # Create another axis on top of the current axis
font2 = Dict("color"=>"purple")
ylabel("Right Axis",fontdict=font2)
p = plot(x,y2,color="purple",linestyle="-",marker="o",label="Second") # Plot a basic line
ax2.set_position(new_position) # Position Method 2
setp(ax2.get_yticklabels(),color="purple") # Y Axis font formatting

ax3 = ax.twinx() # Create another axis on top of the current axis
ax3.spines["right"].set_position(("axes",1.12)) # Offset the y-axis label from the axis itself so it doesn't overlap the second axis
font3 = Dict("color"=>"green")
ylabel("Far Right Axis",fontdict=font3)
p = plot(x,y3,color="green",linestyle="-",marker="o",label="Third") # Plot a basic line
ax3.set_position(new_position) # Position Method 2
setp(ax.get_yticklabels(),color="green") # Y Axis font formatting

axis("tight")

# Enable just the right part of the frame
ax3.set_frame_on(true) # Make the entire frame visible
ax3.patch.set_visible(false) # Make the patch (background) invisible so it doesn't cover up the other axes' plots
ax3.spines["top"].set_visible(false) # Hide the top edge of the axis
ax3.spines["bottom"].set_visible(false) # Hide the bottom edge of the axis

fig.canvas.draw() # Update the figure

Multi-axis Plot


Axis Placement

(IJulia, Code)

ax.spines["top"].set_visible(false) # Hide the top edge of the axis
ax.spines["right"].set_visible(false) # Hide the right edge of the axis
ax.spines["left"].set_position("center") # Move the right axis to the center
ax.spines["bottom"].set_position("center") # Most the bottom axis to the center
ax.xaxis.set_ticks_position("bottom") # Set the x-ticks to only the bottom
ax.yaxis.set_ticks_position("left") # Set the y-ticks to only the left
ax2.spines["top"].set_visible(false) # Hide the top edge of the axis
ax2.spines["right"].set_visible(false) # Hide the right edge of the axis
ax2.xaxis.set_ticks_position("bottom")
ax2.yaxis.set_ticks_position("left")
ax2.spines["left"].set_position(("axes",-0.03)) # Offset the left scale from the axis
ax2.spines["bottom"].set_position(("axes",-0.05)) # Offset the bottom scale from the axis

Axis Placement


Surface and Contour Plots

(IJulia, Code)

Thanks to Daniel Høegh for providing this example.

plot_surface(xgrid, ygrid, z, rstride=2,edgecolors="k", cstride=2,
   cmap=ColorMap("gray"), alpha=0.8, linewidth=0.25)
contour(xgrid, ygrid, z, colors="black", linewidth=2.0)
ax.label(cp, inline=1, fontsize=10)

Surface Plot


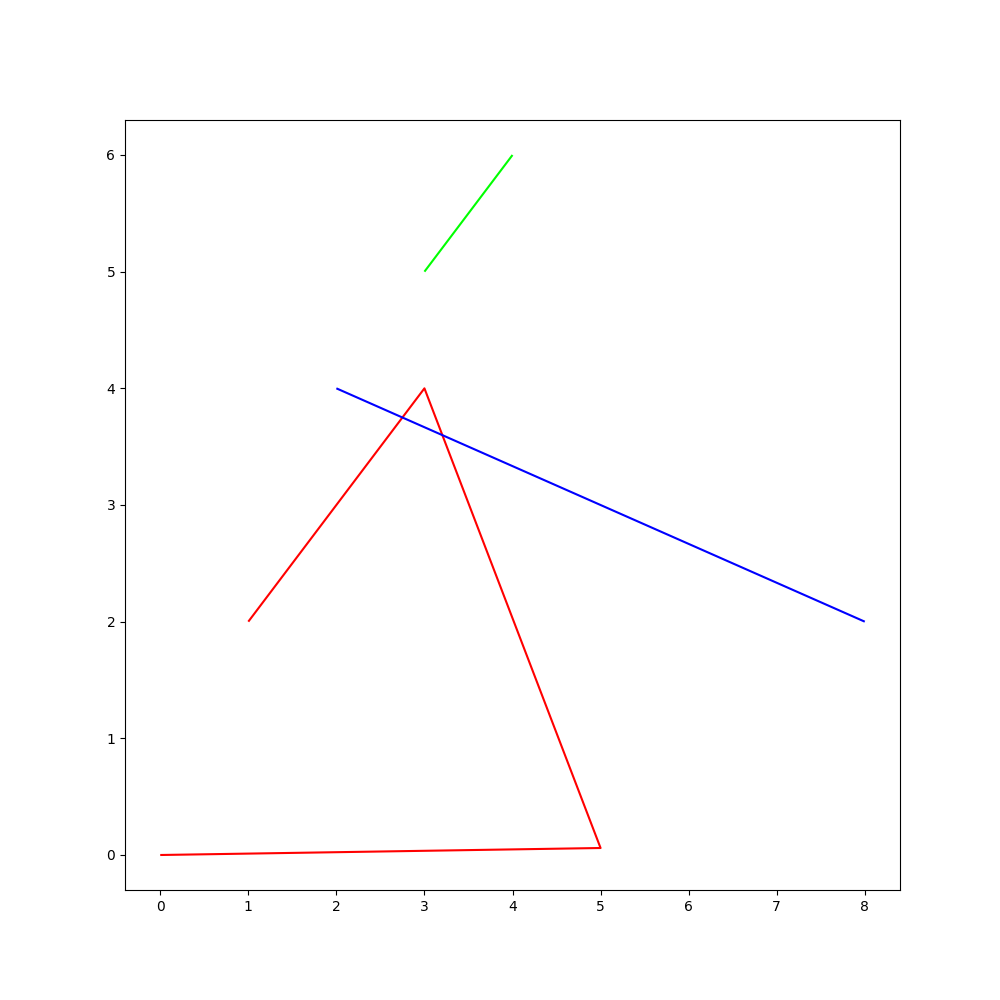
Line Collection

(IJulia, Code)

Thanks to David P. Sanders for this example.

# First Segment Group
xs = [1.,3.,5.,0.]
ys = [2.,4.,.06,0.]
lines = Any[collect(zip(xs,ys))]
# lines = [(1.0,2.0),(3.0,4.0),(5.0,0.06),(0.0,0.0)]

# Second Segment Group
xs = [3.,4]
ys = [5.,6]
push!(lines,collect(zip(xs,ys)))

# Third Segment Group
xs = [8.,2]
ys = [2.,4]
push!(lines,collect(zip(xs,ys)))

##############
##  Colors  ##
##############
# Line segments will be plotted with the following order of colors and will
# cycle back to the beginning of the array when it has gone through all of them
c = Vector{Int}[[1,0,0],[0,1,0],[0,0,1]]

# Assemble everything into a LineCollection
line_segments = matplotlib.collections.LineCollection(lines,colors=c)

############
##  Plot  ##
############
fig = figure("Line Collection Example",figsize=(10,10))
ax = PyPlot.axes()
ax.add_collection(line_segments)
axis("image")

Line Collection


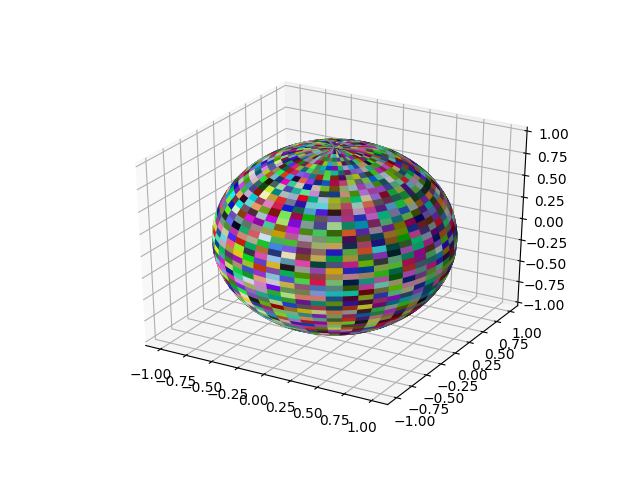
3D Surf Plot

(IJulia, Code)

Thanks to feima0011 for this example.

surf(x,y,z,facecolors=colors)

3D Surf Plot


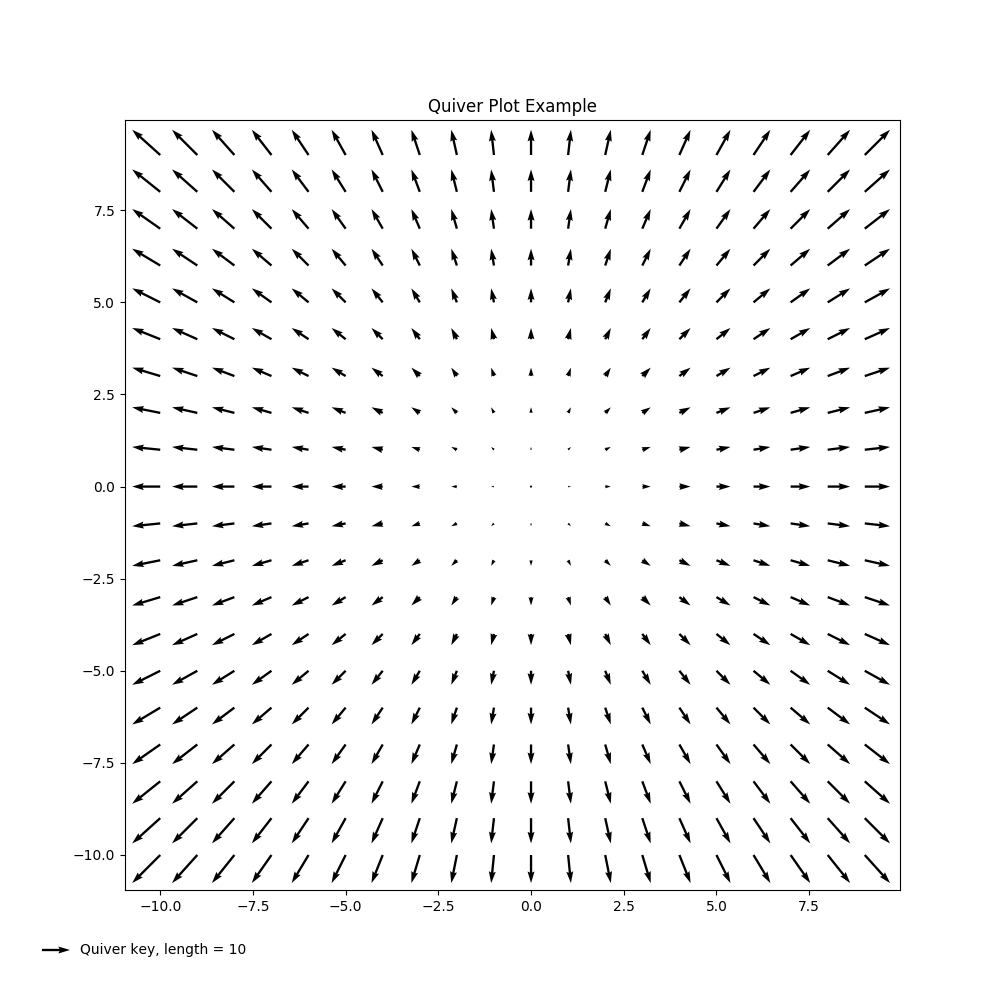
Quiver Plot

(IJulia, Code)

q = quiver(X,Y,U,V)
ax = gca()
ax.quiverkey(q,X=0.07,Y = 0.05, U = 10,coordinates="figure", label="Quiver key, length = 10",labelpos = "E")

Quiver Plot


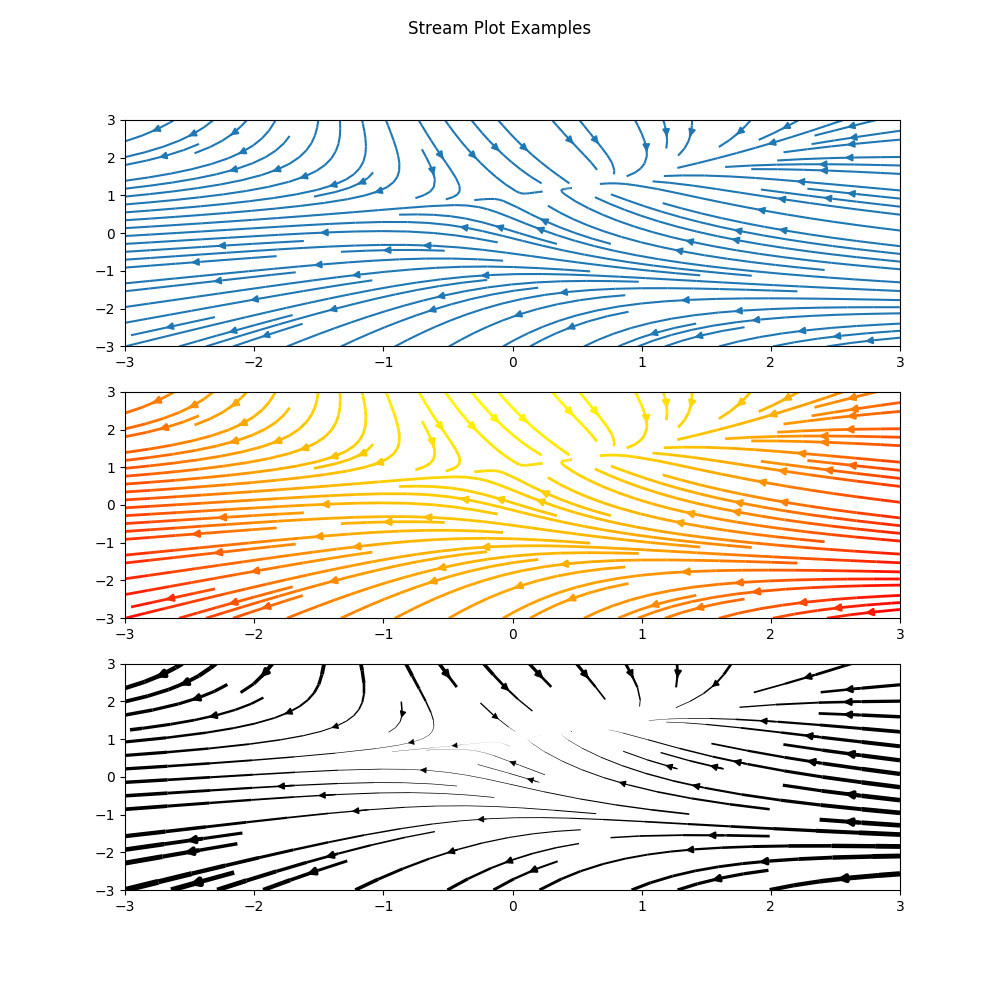
Stream Plot

(IJulia, Code)

streamplot(X,Y,U,V)
streamplot(X,Y,U,V,color=U,linewidth=2,cmap=PyPlot.cm[:autumn])
lw = 5 .* speed ./ maximum(speed) # Line Widths
streamplot(X,Y,U,V,density=0.6,color="k",linewidth=lw)

Stream Plots


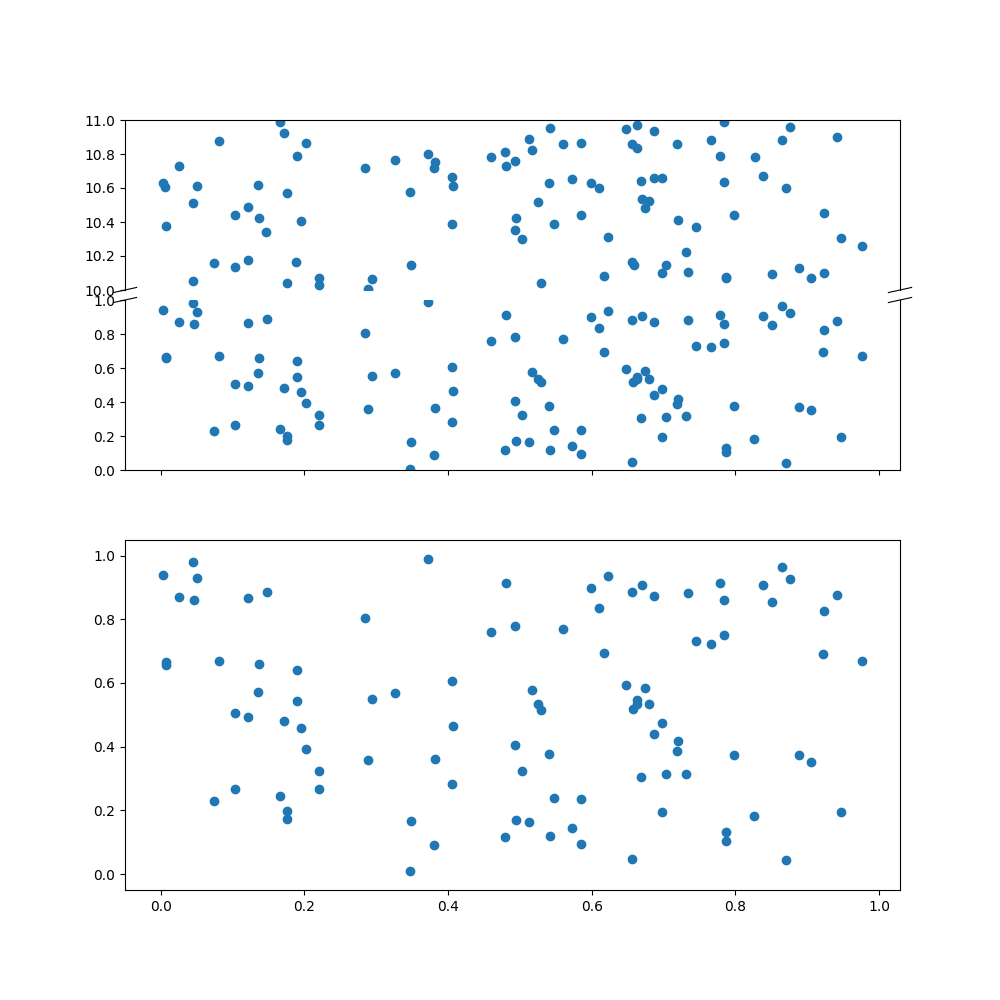
Broken Axis Subplot

(IJulia, Code)

Thanks to Ian Butterworth for providing this example.

axes_grid1 = pyimport("mpl_toolkits.axes_grid1")
divider = axes_grid1.make_axes_locatable(ax)
ax2 = divider.new_vertical(size="100%", pad=0.1)
fig.add_axes(ax2)
ax.spines["top"].set_visible(false)
ax2.spines["bottom"].set_visible(false)
# Upper Line Break Markings
d = 0.015  # how big to make the diagonal lines in axes coordinates
ax2.plot((-d, +d), (-d, +d), transform=ax2.transAxes, color="k", clip_on=false,linewidth=0.8)        # Left diagonal
ax2.plot((1 - d, 1 + d), (-d, +d), transform=ax2.transAxes, color="k", clip_on=false,linewidth=0.8)  # Right diagonal

# Lower Line Break Markings
ax.plot((-d, +d), (1 - d, 1 + d), transform=ax.transAxes, color="k", clip_on=false,linewidth=0.8)  # Left diagonal
ax.plot((1 - d, 1 + d), (1 - d, 1 + d), transform=ax.transAxes, color="k", clip_on=false,linewidth=0.8)  # Right diagonal

Broken Axis Subplot

@floswald
Copy link

floswald commented Mar 8, 2016

@gizmaa, i found knowing some basic window manipulation very useful. things like

PyPlot.close()   # close all plot windows

fig,axes = subplots(1,2)   # create figure and axes
ax = axes[1]     # operate on subplot 1
ax[:plot](1:10,rand(10),color="red")
ax[:plot](1:10,rand(10),color="green")
ax = axes[2]      # operate on subplot 2
ax[:plot](1:10,ones(10),color="yellow")
ax[:plot](1:10,1:10,color="black")
fig[:canvas][:set_window_title]("title of window")

fig[:canvas][:draw]()   # update the figure to draw if you're doing this in the REPL

@gizmaa
Copy link
Author

gizmaa commented Mar 8, 2016

@benavoli, I updated the pi chart example with font tweaks. See the Code link for more details.

@floswald, thanks for the tips. I've seen a lot of them and use them in my own code but haven't gotten around to adding a more complex example using them. It would be interesting to do a comparison of the different methods for the same thing.

# Create a new figure
fig = figure("Title of Window",figsize=(10,10)) # Window title and size

close("all") # Close all plot windows

@innerlee
Copy link

subplot(YXN) => subplot(XYN)

@hiemstar
Copy link

Very helpful examples!

A bit more complicated. Does anyone know how to plot a 3D surface as in the surface plot above, however with e.g the norm of
the surface-gradient as the face color?

@gabrielgellner
Copy link

Just one more voice for how great this is! Thanks so much.

@jmarcellopereira
Copy link

How to plot implict function in julia?

@gizmaa
Copy link
Author

gizmaa commented Nov 14, 2016

Updated for Julia 0.5

@feima0011
Copy link

I have code about plotting on a sphere.

plot on a sphere

u = linspace(0.0,2pi,100);
v = linspace(0.0,pi,100);

lu = length(u);
lv = length(v);

x = zeros(lu,lv);
y = zeros(lu,lv);
z = zeros(lu,lv);

colors = zeros(lu,lv,3) ;

colortube = 0.001:0.001:1.0;

for uu=1:lu
for vv=1:lv
x[uu,vv]= cos(u[uu])*sin(v[vv]);
y[uu,vv]= sin(u[uu])*sin(v[vv]);
z[uu,vv]= cos(v[vv]);
end
end

for uu=1:lu
for vv=1:lv
for ii=1:3
colors[uu,vv,ii]=rand(colortube);
end
end
end

#surf(x,y,z,facecolors=colors);
surf(x,y,z,facecolors=colors);
savefig("3d.eps",format="eps",dpi=1000);

sphere

@gizmaa
Copy link
Author

gizmaa commented Jun 23, 2017

@feima0011 The results seem to be inconsistent. Mine looks like this:

figure_1

Are you using any other special settings?

My system:
Kubuntu 16.04 (Linux)
Julia 0.6.0-rc3.0

@feima0011
Copy link

@gizmaa NO other special settings , plot more patches, I think you should get the desired results.

@gizmaa
Copy link
Author

gizmaa commented Jul 25, 2017

@feima0011 Your example has been added.

@mboedigh
Copy link

mboedigh commented Sep 2, 2017

You are probably aware. But this doesn't work as written. I personally have no idea how to make it work, because I'm too new to any of this.

ax:set_ylim
UndefVarError: ax not defined

I guess it's far too much trouble to add a line or two to make the examples actually work....

@gizmaa
Copy link
Author

gizmaa commented Sep 29, 2017

@mboedigh I'm assuming you're talking about the Python/Julia comparison at the very top. It's not meant to be a full example but a comparison of how to translate Python to Julia.

ax = axes()
ax[:set_ylim]([-30,10])

An easier way is to just use ylim([-30,10]).

Click either link in (IJulia,Code) for fully functional code. This gist is written so that the important bits for each section are quickly and easily visible. All of the rest are in the full example links I've already mentioned.

I guess it's far too much trouble to add a line or two to make the examples actually work....

I would also suggest you use a different tone when asking for free help or taking issue with something somebody provides online free of charge. Not everybody will be as kind. Keep in mind Github is collaborative.

@davidphysdavalos
Copy link

Hey, thanks a lot for the useful examples!, by the way, do you have one for vector fields and streamplot?

@gizmaa
Copy link
Author

gizmaa commented Oct 10, 2017

It's not often that I add examples quickly so give the examples in the matplotlib gallery a try. Most of the time it's just using the command as it would be in Python. The finer points may require a little bit of tweaking but the translation examples are in the first section of this document.

If you've created an example and would like it added here just post it somewhere and tell me. When I find time I will clean it up if it needs to be and add it, citing you in the code and snippet. See the "Line Collection" and "3D Surf Plot" examples for how I cite.

@davidphysdavalos the quiver (vector field) and streamplot examples have been added.

@CarloLucibello
Copy link

CarloLucibello commented Oct 15, 2017

some code for plotting MNIST images, if of any interest. Showing subplots, imshow, axes removal and tight_layout with negative paddings to remove all interspaces.

MLDatasets has not been published to METADATA yet and has to be cloned from here

using PyPlot
import MLDatasets: MNIST
import IterTools: product

x, y = MNIST.testdata()
nrow, ncol = 4, 4
fig = figure("plot_mnist",figsize=(6,6))
for (i, (c, r)) in enumerate(product(1:ncol, 1:nrow))
    subplot(nrow, ncol, i)
    imshow(x[:,:,i]', cmap="gray") #notice the transpose
    ax = gca()
    ax[:xaxis][:set_visible](false)
    ax[:yaxis][:set_visible](false)
end
tight_layout(w_pad=-1, h_pad=-1, pad=-0.5)

plot_mnist

@zhangliye
Copy link

extremely helpful!

@mafla
Copy link

mafla commented Feb 23, 2018

This is an extremely helpful collection of examples! Thank you all!

I am plying with this for the first time and have a question, as I don’t fully understand the logic of this yet.

  • How can I make sure that the labels of the colorbar don’t overlap with the ticks?
  • How can I use the set_label_postion to "left"?
  • How can I rotate the labels of my labels (Jan, Feb, …) e.g. with set_rotation?

Greetings!

using PyPlot

fig = figure("polar_lineplot", figsize = (10, 10)) 

# create a polar axis
ax = axes(polar = "true") 

# define time (all could be done more elegantly in julia I guess... )
time_ang = 1:0.25:13
N_time   = length(time_ang)
time_ang = time_ang .* (360/12)
time_rad = time_ang .* (pi / 180)
   
# create a continous var for the background
N_div  = N_time*10
N_max  = 6
y      = linspace(0, N_max, N_div)

# grid to fill the polar plot
xgrid  = repmat(time_rad', N_div, 1)
ygrid  = repmat(y, 1, N_time)

# background to the range of values 
axsurf = ax[:contourf](xgrid, ygrid, ygrid, N_max,
                       cmap=ColorMap("gray_r"), 
                       extend="max")
# add colorbar
cb = colorbar(axsurf, fraction = 0.05, shrink = 0.5, pad = 0.1)
cb[:set_label](label = "Variable [units]", rotation=270)

# add your data
p   = plot(time_rad, rand(length(time_rad)).*3)

# set polar ticks and labels
month_ang = 0:11
month_ang = month_ang .* (360/12)
month_lab = ["Jan"; "Feb"; "Mar"; "Apr"; "May"; "Jun"; "Jul"; "Aug"; "Sep"; "Oct"; "Nov"; "Dez"]

ax[:set_thetagrids]([angles = month_ang;],
                    [labels = month_lab;],
                    [frac=1.2;],
                    [rotation = month_ang;],) 

# set Jan to the top of the plot
ax[:set_theta_zero_location]("N") 

# switch to clockwise
ax[:set_theta_direction](-1) 

polartest

@gizmaa
Copy link
Author

gizmaa commented Mar 15, 2018

@mafla cb[:set_label]("Variable [units]",labelpad=15)

I adjusted this Stack Overflow answer. Hopefully my answer isn't too late for your plot.

After more complex plots I would recommend using fig[:canvas][:draw]. Commands may work but not update the plot itself.

Edit: forgot the link

@samjurl
Copy link

samjurl commented May 4, 2018

Hi, maybe it is a stupid question but how does one manipulate the figure object? For example, if I create a figure f in one cell then plot it, and then wish to zoom (using xlim, ylim) in on regions in different cells, without having to completely re-plot every time?

@gizmaa
Copy link
Author

gizmaa commented May 24, 2018

@samjurl There are buttons on the figure itself along with keyboard shortcuts to help you navigate. If you aren't seeing them then the first thing to try are the shortcuts. 'o' will let you interactively zoom in and out. 'r' will restore the zoom state to the initial settings. I'm not sure what could cause the controls be nonexistent.

@ivemv
Copy link

ivemv commented Jul 15, 2018

Hi
Thanks for the examples, very useful!
i have a question.., i'm trying to plot three graphics but i want it all for different size and i can't do it yet, some idea to?

@gizmaa
Copy link
Author

gizmaa commented Jul 19, 2018

@ivemv What exactly do you mean? Do you want three independent plots each with a different size? Do you want one window with three plots each with a different size?

Figures are easy.

fig1 = figure("First Figure",figsize(4,4))
# Plot something

fig2 = figure("Second Figure",figsize=(5,3))
# Plot something

fig3 = figure("Third Figure",figsize=(5,10))
# Plot something

The second scenario is a little more annoying.

fig = figure(figsize=(8,6))
ax1 = axes(position=[.2,.2,.5,.5])
# Plot something

ax2 = axes(position=[.8,.1,.1,.8])
# Plot something

The position in the axes case is a percentage where the first two numbers are the location of the lower left corner of the axes and the second two are the size. Both sets of numbers are based on the lower left corner of the figure, [0,0] is the lower left corner. ax2 would then start at 80% right along the x-axis, 10% up on the y-axis and be 10% wide and 80% high.

@Moelf
Copy link

Moelf commented Sep 1, 2018

Hist plotting does not work in 1.0;
I guess you will have to do something like
PyPlot.grid

@gizmaa
Copy link
Author

gizmaa commented Sep 3, 2018

At the moment I'm really behind in updating to Julia 0.7/1.0. Once work settles down I should have more time to make the updates.

@IanButterworth
Copy link

I converted the broken axis in a subplot example from here and thought it would be a helpful example

using PyPlot, PyCall
@pyimport mpl_toolkits.axes_grid1 as axes_grid1

x = rand(100)
y = rand(100)
y2 = rand(100).+10

fig, axes = subplots(nrows=2, sharex=true)

ax = axes[1]
divider = axes_grid1.make_axes_locatable(ax)
ax2 = divider[:new_vertical](size="100%", pad=0.1)
fig[:add_axes](ax2)

ax[:scatter](x, y)
ax[:set_ylim](0, 1)
ax[:spines]["top"][:set_visible](false)

ax2[:scatter](x, y2)
ax2[:set_ylim](10, 11)
ax2[:tick_params](bottom="off", labelbottom="off")
ax2[:spines]["bottom"][:set_visible](false)


# From https://matplotlib.org/examples/pylab_examples/broken_axis.html
d = 0.015  # how big to make the diagonal lines in axes coordinates
ax2[:plot]((-d, +d), (-d, +d), transform=ax2[:transAxes], color="k", clip_on=false,linewidth=0.8)        # top-left diagonal
ax2[:plot]((1 - d, 1 + d), (-d, +d), transform=ax2[:transAxes], color="k", clip_on=false,linewidth=0.8)  # top-right diagonal

ax[:plot]((-d, +d), (1 - d, 1 + d), transform=ax[:transAxes], color="k", clip_on=false,linewidth=0.8)  # bottom-left diagonal
ax[:plot]((1 - d, 1 + d), (1 - d, 1 + d), transform=ax[:transAxes], color="k", clip_on=false,linewidth=0.8)  # bottom-right diagonal


#create bottom subplot as usual
axes[2][:scatter](x, y)

image

@gerritgr
Copy link

Hey, has anyone figured out how to use the surface plot (https://gist.github.com/gizmaa/7214002#surface-and-contour-plots) in Julia 1.x? Thanks

@gizmaa
Copy link
Author

gizmaa commented May 10, 2019

@gerritgr Everything has finally been updated.

Next week I will try and double check everything and add an example or two.

@houchmandzadeh
Copy link

@Gizma Many thanks for this fast tutorial that I have been using for few years.
Here a small code for making "inset" plotting.

myfig = gcf()
clf()

t = 0:0.05:2*pi
x = sin.(t)
y = cos.(t)

plot(t,x)
ax2 = myfig.add_axes([0.6,0.6,0.25,0.25])
plot(x,y,"-r")
inset

@santoshbalija
Copy link

This awesome !!

Sign up for free to join this conversation on GitHub. Already have an account? Sign in to comment