Created
December 21, 2021 08:48
-
-
Save hardenchant/44485b69b4788d512767620197b648a4 to your computer and use it in GitHub Desktop.
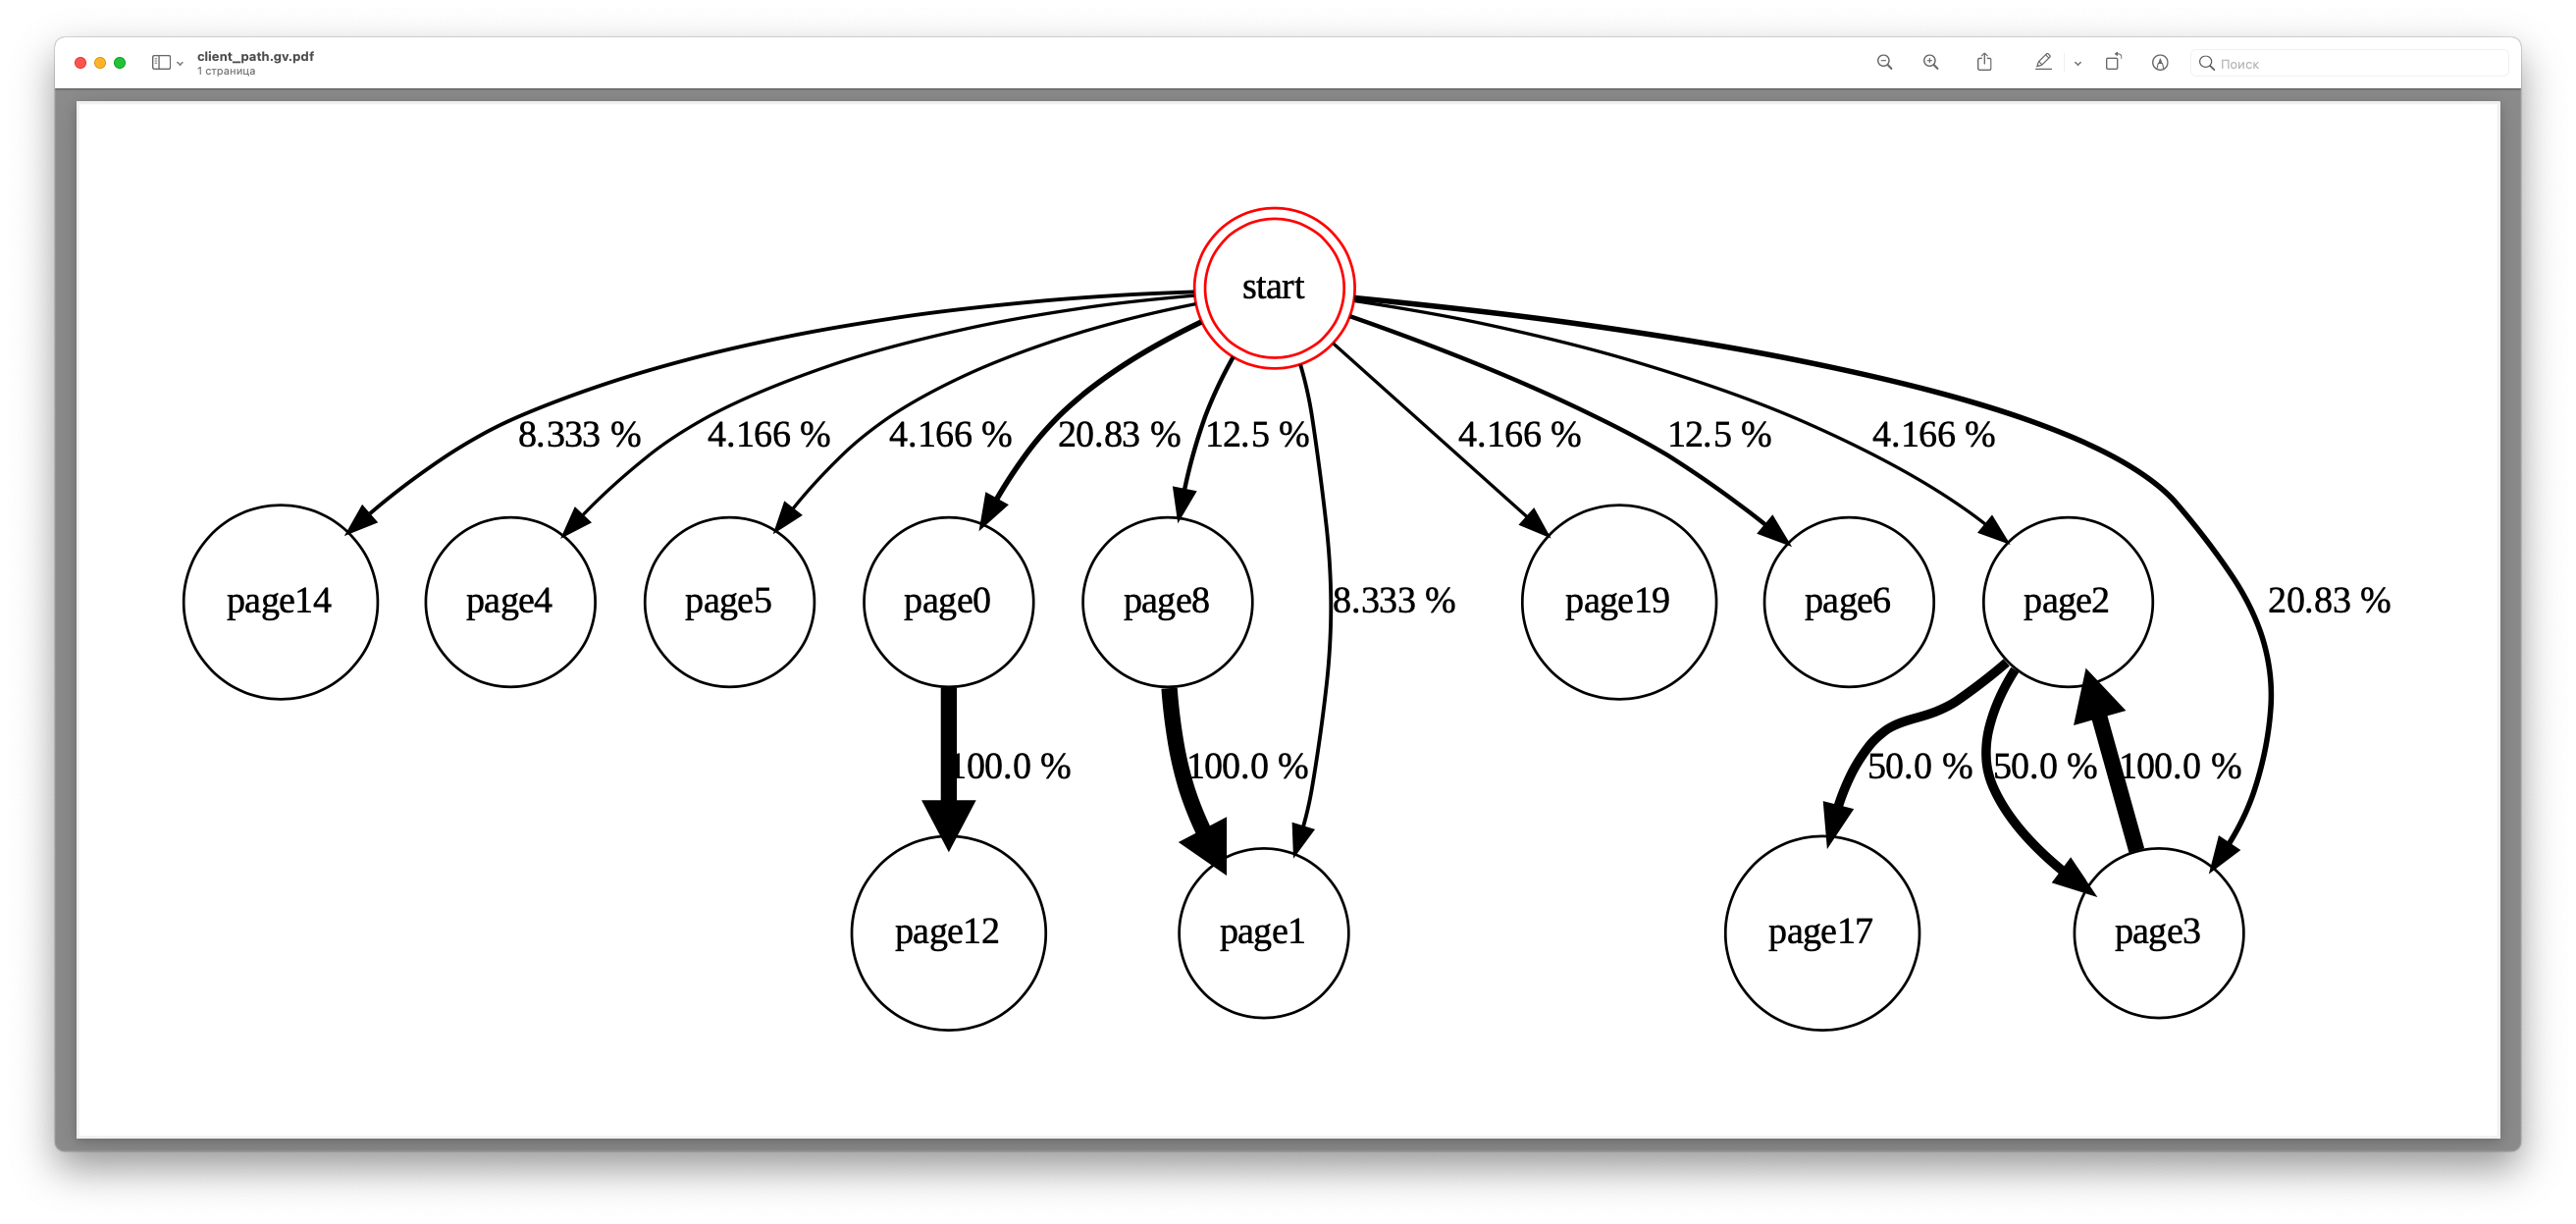
Render clientpath graph with GraphViz
This file contains bidirectional Unicode text that may be interpreted or compiled differently than what appears below. To review, open the file in an editor that reveals hidden Unicode characters.
Learn more about bidirectional Unicode characters
| import random | |
| from datetime import datetime, timedelta | |
| import graphviz | |
| def generate_sample_data(): | |
| clients = [i for i in range(100)] | |
| events = [f'page{i}' for i in range(20)] | |
| now = datetime.now() | |
| def generate_random_line(pointer=1): | |
| data = { | |
| "client_id": clients[int(random.random() * len(clients) / pointer)], | |
| "event": events[int(random.random() * len(events) / pointer)], | |
| "timestamp": (now - timedelta(seconds=random.randrange(60 * 60 * 24 * 14))).isoformat() | |
| } | |
| return f'{data["timestamp"]},{data["client_id"]},{data["event"]}' | |
| with open("source.csv", 'w') as f: | |
| f.write('timestamp,client_id,event\n') | |
| for i in range(1, 4): | |
| for _ in range(10): | |
| l = generate_random_line(i) | |
| f.write(f'{l}\n') | |
| def main(): | |
| data_by_client = {} | |
| with open("source.csv", 'r') as f: | |
| # pop csv header line | |
| f.readline() | |
| for line in f: | |
| isotimestamp, client_id, event = [i.strip() for i in line.split(',')] | |
| timestamp = datetime.fromisoformat(isotimestamp).timestamp() | |
| data_by_client[client_id] = {**data_by_client.get(client_id, {}), timestamp: event} | |
| # a: {b: 1, c: 2, d: 3} | |
| node_stat = {} | |
| for client, data in data_by_client.items(): | |
| last_node = 'start' | |
| for timestamp in sorted(data.keys()): | |
| cur_node = data[timestamp] | |
| if last_node in node_stat: | |
| node_stat[last_node]['__count'] += 1 | |
| if cur_node in node_stat[last_node]: | |
| node_stat[last_node][cur_node] += 1 | |
| else: | |
| node_stat[last_node][cur_node] = 1 | |
| else: | |
| node_stat[last_node] = {cur_node: 1, '__count': 1} | |
| last_node = cur_node | |
| f = graphviz.Digraph('client_path') | |
| f.attr('node', shape='doublecircle') | |
| f.attr('node', color='red') | |
| f.node('start') | |
| f.attr('node', color='black') | |
| f.attr('node', shape='circle') | |
| for node, paths in node_stat.items(): | |
| all_paths_count = paths['__count'] | |
| for to_node, to_node_count in paths.items(): | |
| if to_node == '__count': | |
| continue | |
| f.attr('edge', penwidth=f'{1 + to_node_count / all_paths_count * 5}') | |
| f.edge(node, to_node, label=f'{str(to_node_count / all_paths_count * 100)[:5]} %') | |
| f.render(directory='./') | |
| if __name__ == '__main__': | |
| main() |
Sign up for free
to join this conversation on GitHub.
Already have an account?
Sign in to comment
Graph example