Last active
February 21, 2024 19:51
-
-
Save hitvoice/36cf44689065ca9b927431546381a3f7 to your computer and use it in GitHub Desktop.
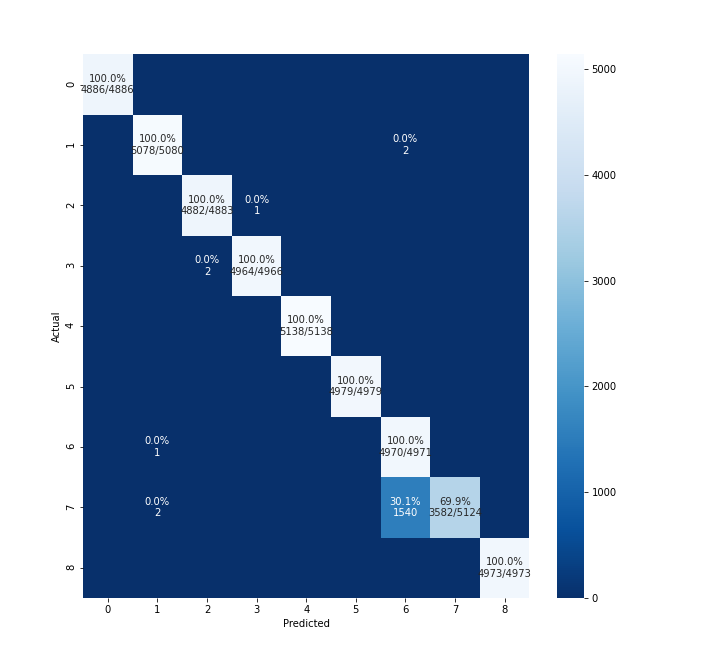
Generate matrix plot for confusion matrix with pretty annotations.

This file contains bidirectional Unicode text that may be interpreted or compiled differently than what appears below. To review, open the file in an editor that reveals hidden Unicode characters.
Learn more about bidirectional Unicode characters
| import numpy as np | |
| import pandas as pd | |
| import matplotlib.pyplot as plt | |
| import seaborn as sns | |
| from sklearn.metrics import confusion_matrix | |
| def cm_analysis(y_true, y_pred, filename, labels, ymap=None, figsize=(10,10)): | |
| """ | |
| Generate matrix plot of confusion matrix with pretty annotations. | |
| The plot image is saved to disk. | |
| args: | |
| y_true: true label of the data, with shape (nsamples,) | |
| y_pred: prediction of the data, with shape (nsamples,) | |
| filename: filename of figure file to save | |
| labels: string array, name the order of class labels in the confusion matrix. | |
| use `clf.classes_` if using scikit-learn models. | |
| with shape (nclass,). | |
| ymap: dict: any -> string, length == nclass. | |
| if not None, map the labels & ys to more understandable strings. | |
| Caution: original y_true, y_pred and labels must align. | |
| figsize: the size of the figure plotted. | |
| """ | |
| if ymap is not None: | |
| y_pred = [ymap[yi] for yi in y_pred] | |
| y_true = [ymap[yi] for yi in y_true] | |
| labels = [ymap[yi] for yi in labels] | |
| cm = confusion_matrix(y_true, y_pred, labels=labels) | |
| cm_sum = np.sum(cm, axis=1, keepdims=True) | |
| cm_perc = cm / cm_sum.astype(float) * 100 | |
| annot = np.empty_like(cm).astype(str) | |
| nrows, ncols = cm.shape | |
| for i in range(nrows): | |
| for j in range(ncols): | |
| c = cm[i, j] | |
| p = cm_perc[i, j] | |
| if i == j: | |
| s = cm_sum[i] | |
| annot[i, j] = '%.1f%%\n%d/%d' % (p, c, s) | |
| elif c == 0: | |
| annot[i, j] = '' | |
| else: | |
| annot[i, j] = '%.1f%%\n%d' % (p, c) | |
| cm = pd.DataFrame(cm, index=labels, columns=labels) | |
| cm.index.name = 'Actual' | |
| cm.columns.name = 'Predicted' | |
| fig, ax = plt.subplots(figsize=figsize) | |
| sns.heatmap(cm, annot=annot, fmt='', ax=ax) | |
| plt.savefig(filename) |
@rajeshkalakoti pass the value of ymap (dict[Any,str]) to cm_analysis. You can configure the class names in ymap.
for instance, labels are like "class-1, class-2,class-3, class-4,class-5, class-6,class-7, class-8,classs-9", how to configure it?
Sign up for free
to join this conversation on GitHub.
Already have an account?
Sign in to comment
@hitvoice, it's really appreciated work. how to changet the
clf.classes_to other, for instance my classess are from 0 to 8, but i want to change those labels to string.