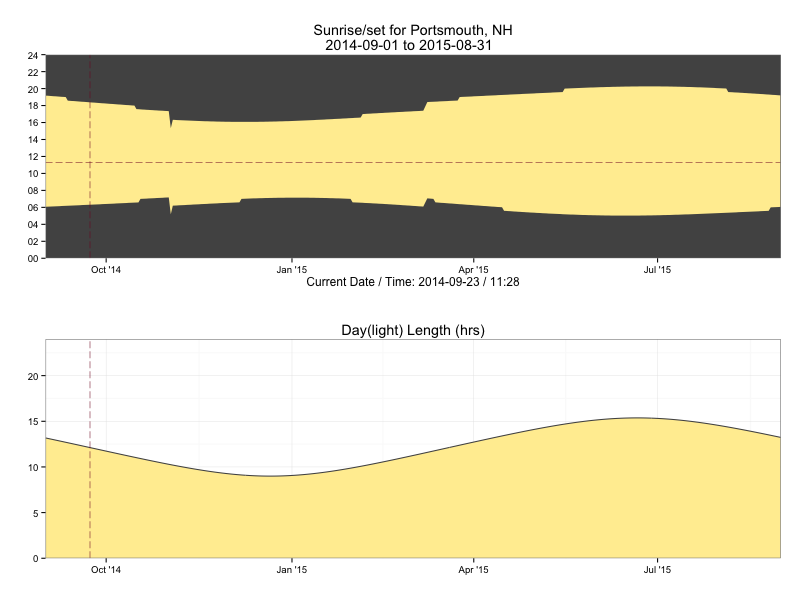
grid::grid.draw(daylight(43.071755, -70.762553, "Portsmouth, NH", "2014-09-01", 365, tz="America/New_York"))
Last active
January 17, 2023 16:54
-
-
Save hrbrmstr/96b136bdfb74ffc258e2 to your computer and use it in GitHub Desktop.
This file contains bidirectional Unicode text that may be interpreted or compiled differently than what appears below. To review, open the file in an editor that reveals hidden Unicode characters.
Learn more about bidirectional Unicode characters
| library(maptools) | |
| library(ggplot2) | |
| library(gridExtra) | |
| library(scales) | |
| # adapted from http://r.789695.n4.nabble.com/maptools-sunrise-sunset-function-td874148.html | |
| ephemeris <- function(lat, lon, date, span=1, tz="UTC") { | |
| lon.lat <- matrix(c(lon, lat), nrow=1) | |
| # using noon gets us around daylight saving time issues | |
| day <- as.POSIXct(sprintf("%s 12:00:00", date), tz=tz) | |
| sequence <- seq(from=day, length.out=span , by="days") | |
| sunrise <- sunriset(lon.lat, sequence, direction="sunrise", POSIXct.out=TRUE) | |
| sunset <- sunriset(lon.lat, sequence, direction="sunset", POSIXct.out=TRUE) | |
| solar_noon <- solarnoon(lon.lat, sequence, POSIXct.out=TRUE) | |
| data.frame(date=as.Date(sunrise$time), | |
| sunrise=as.numeric(format(sunrise$time, "%H%M")), | |
| solarnoon=as.numeric(format(solar_noon$time, "%H%M")), | |
| sunset=as.numeric(format(sunset$time, "%H%M")), | |
| day_length=as.numeric(sunset$time-sunrise$time)) | |
| } | |
| # for graph #1 y-axis | |
| time_format <- function(hrmn) substr(sprintf("%04d", hrmn),1,2) | |
| # for graph #2 y-axis | |
| pad5 <- function(num) sprintf("%2d", num) | |
| daylight <- function(lat, lon, place, start_date, span=2, tz="UTC", show_solar_noon=FALSE, show_now=TRUE, plot=TRUE) { | |
| stopifnot(span>=2) | |
| srss <- ephemeris(lat, lon, start_date, span, tz) | |
| x_label = "" | |
| gg <- ggplot(srss, aes(x=date)) | |
| gg <- gg + geom_ribbon(aes(ymin=sunrise, ymax=sunset), fill="#ffeda0") | |
| if (show_solar_noon) gg <- gg + geom_line(aes(y=solarnoon), color="#fd8d3c") | |
| if (show_now) { | |
| gg <- gg + geom_vline(xintercept=as.numeric(as.Date(Sys.time())), color="#800026", linetype="longdash", size=0.25) | |
| gg <- gg + geom_hline(yintercept=as.numeric(format(Sys.time(), "%H%M")), color="#800026", linetype="longdash", size=0.25) | |
| x_label = sprintf("Current Date / Time: %s", format(Sys.time(), "%Y-%m-%d / %H:%M")) | |
| } | |
| gg <- gg + scale_x_date(expand=c(0,0), labels=date_format("%b '%y")) | |
| gg <- gg + scale_y_continuous(labels=time_format, limits=c(0,2400), breaks=seq(0, 2400, 200), expand=c(0,0)) | |
| gg <- gg + labs(x=x_label, y="", | |
| title=sprintf("Sunrise/set for %s\n%s ", place, paste0(range(srss$date), sep=" ", collapse="to "))) | |
| gg <- gg + theme_bw() | |
| gg <- gg + theme(panel.background=element_rect(fill="#525252")) | |
| gg <- gg + theme(panel.grid=element_blank()) | |
| gg1 <- ggplot(srss, aes(x=date, y=day_length)) | |
| gg1 <- gg1 + geom_area(fill="#ffeda0") | |
| gg1 <- gg1 + geom_line(color="#525252") | |
| if (show_now) gg1 <- gg1 + geom_vline(xintercept=as.numeric(as.Date(Sys.time())), color="#800026", linetype="longdash", size=0.25) | |
| gg1 <- gg1 + scale_x_date(expand=c(0,0), labels=date_format("%b '%y")) | |
| gg1 <- gg1 + scale_y_continuous(labels=pad5, limits=c(0,24), expand=c(0,0)) | |
| gg1 <- gg1 + labs(x="", y="", title="Day(light) Length (hrs)") | |
| gg1 <- gg1 + theme_bw() | |
| if (plot) grid.arrange(gg, gg1, nrow=2) | |
| arrangeGrob(gg, gg1, nrow=2) | |
| } |
Sign up for free
to join this conversation on GitHub.
Already have an account?
Sign in to comment