-
-
Save huks0/e48d604fc9dd91731bc687d6e3933db4 to your computer and use it in GitHub Desktop.
| import cv2 | |
| import numpy as np | |
| import pandas as pd | |
| import matplotlib.pyplot as plt | |
| import csv | |
| try: | |
| from PIL import Image | |
| except ImportError: | |
| import Image | |
| import pytesseract | |
| #read your file | |
| file=r'/Users/marius/Desktop/Masterarbeit/Medium/Medium.png' | |
| img = cv2.imread(file,0) | |
| img.shape | |
| #thresholding the image to a binary image | |
| thresh,img_bin = cv2.threshold(img,128,255,cv2.THRESH_BINARY | cv2.THRESH_OTSU) | |
| #inverting the image | |
| img_bin = 255-img_bin | |
| cv2.imwrite('/Users/marius/Desktop/cv_inverted.png',img_bin) | |
| #Plotting the image to see the output | |
| plotting = plt.imshow(img_bin,cmap='gray') | |
| plt.show() | |
| # countcol(width) of kernel as 100th of total width | |
| kernel_len = np.array(img).shape[1]//100 | |
| # Defining a vertical kernel to detect all vertical lines of image | |
| ver_kernel = cv2.getStructuringElement(cv2.MORPH_RECT, (1, kernel_len)) | |
| # Defining a horizontal kernel to detect all horizontal lines of image | |
| hor_kernel = cv2.getStructuringElement(cv2.MORPH_RECT, (kernel_len, 1)) | |
| # A kernel of 2x2 | |
| kernel = cv2.getStructuringElement(cv2.MORPH_RECT, (2, 2)) | |
| #Use vertical kernel to detect and save the vertical lines in a jpg | |
| image_1 = cv2.erode(img_bin, ver_kernel, iterations=3) | |
| vertical_lines = cv2.dilate(image_1, ver_kernel, iterations=3) | |
| cv2.imwrite("/Users/marius/Desktop/vertical.jpg",vertical_lines) | |
| #Plot the generated image | |
| plotting = plt.imshow(image_1,cmap='gray') | |
| plt.show() | |
| #Use horizontal kernel to detect and save the horizontal lines in a jpg | |
| image_2 = cv2.erode(img_bin, hor_kernel, iterations=3) | |
| horizontal_lines = cv2.dilate(image_2, hor_kernel, iterations=3) | |
| cv2.imwrite("/Users/marius/Desktop/horizontal.jpg",horizontal_lines) | |
| #Plot the generated image | |
| plotting = plt.imshow(image_2,cmap='gray') | |
| plt.show() | |
| # Combine horizontal and vertical lines in a new third image, with both having same weight. | |
| img_vh = cv2.addWeighted(vertical_lines, 0.5, horizontal_lines, 0.5, 0.0) | |
| #Eroding and thesholding the image | |
| img_vh = cv2.erode(~img_vh, kernel, iterations=2) | |
| thresh, img_vh = cv2.threshold(img_vh,128,255, cv2.THRESH_BINARY | cv2.THRESH_OTSU) | |
| cv2.imwrite("/Users/marius/Desktop/img_vh.jpg", img_vh) | |
| bitxor = cv2.bitwise_xor(img,img_vh) | |
| bitnot = cv2.bitwise_not(bitxor) | |
| #Plotting the generated image | |
| plotting = plt.imshow(bitnot,cmap='gray') | |
| plt.show() | |
| # Detect contours for following box detection | |
| contours, hierarchy = cv2.findContours(img_vh, cv2.RETR_TREE, cv2.CHAIN_APPROX_SIMPLE) | |
| def sort_contours(cnts, method="left-to-right"): | |
| # initialize the reverse flag and sort index | |
| reverse = False | |
| i = 0 | |
| # handle if we need to sort in reverse | |
| if method == "right-to-left" or method == "bottom-to-top": | |
| reverse = True | |
| # handle if we are sorting against the y-coordinate rather than | |
| # the x-coordinate of the bounding box | |
| if method == "top-to-bottom" or method == "bottom-to-top": | |
| i = 1 | |
| # construct the list of bounding boxes and sort them from top to | |
| # bottom | |
| boundingBoxes = [cv2.boundingRect(c) for c in cnts] | |
| (cnts, boundingBoxes) = zip(*sorted(zip(cnts, boundingBoxes), | |
| key=lambda b:b[1][i], reverse=reverse)) | |
| # return the list of sorted contours and bounding boxes | |
| return (cnts, boundingBoxes) | |
| # Sort all the contours by top to bottom. | |
| contours, boundingBoxes = sort_contours(contours, method="top-to-bottom") | |
| #Creating a list of heights for all detected boxes | |
| heights = [boundingBoxes[i][3] for i in range(len(boundingBoxes))] | |
| #Get mean of heights | |
| mean = np.mean(heights) | |
| #Create list box to store all boxes in | |
| box = [] | |
| # Get position (x,y), width and height for every contour and show the contour on image | |
| for c in contours: | |
| x, y, w, h = cv2.boundingRect(c) | |
| if (w<1000 and h<500): | |
| image = cv2.rectangle(img,(x,y),(x+w,y+h),(0,255,0),2) | |
| box.append([x,y,w,h]) | |
| plotting = plt.imshow(image,cmap='gray') | |
| plt.show() | |
| #Creating two lists to define row and column in which cell is located | |
| row=[] | |
| column=[] | |
| j=0 | |
| #Sorting the boxes to their respective row and column | |
| for i in range(len(box)): | |
| if(i==0): | |
| column.append(box[i]) | |
| previous=box[i] | |
| else: | |
| if(box[i][1]<=previous[1]+mean/2): | |
| column.append(box[i]) | |
| previous=box[i] | |
| if(i==len(box)-1): | |
| row.append(column) | |
| else: | |
| row.append(column) | |
| column=[] | |
| previous = box[i] | |
| column.append(box[i]) | |
| print(column) | |
| print(row) | |
| #calculating maximum number of cells | |
| countcol = 0 | |
| for i in range(len(row)): | |
| countcol = len(row[i]) | |
| if countcol > countcol: | |
| countcol = countcol | |
| #Retrieving the center of each column | |
| center = [int(row[i][j][0]+row[i][j][2]/2) for j in range(len(row[i])) if row[0]] | |
| center=np.array(center) | |
| center.sort() | |
| print(center) | |
| #Regarding the distance to the columns center, the boxes are arranged in respective order | |
| finalboxes = [] | |
| for i in range(len(row)): | |
| lis=[] | |
| for k in range(countcol): | |
| lis.append([]) | |
| for j in range(len(row[i])): | |
| diff = abs(center-(row[i][j][0]+row[i][j][2]/4)) | |
| minimum = min(diff) | |
| indexing = list(diff).index(minimum) | |
| lis[indexing].append(row[i][j]) | |
| finalboxes.append(lis) | |
| #from every single image-based cell/box the strings are extracted via pytesseract and stored in a list | |
| outer=[] | |
| for i in range(len(finalboxes)): | |
| for j in range(len(finalboxes[i])): | |
| inner='' | |
| if(len(finalboxes[i][j])==0): | |
| outer.append(' ') | |
| else: | |
| for k in range(len(finalboxes[i][j])): | |
| y,x,w,h = finalboxes[i][j][k][0],finalboxes[i][j][k][1], finalboxes[i][j][k][2],finalboxes[i][j][k][3] | |
| finalimg = bitnot[x:x+h, y:y+w] | |
| kernel = cv2.getStructuringElement(cv2.MORPH_RECT, (2, 1)) | |
| border = cv2.copyMakeBorder(finalimg,2,2,2,2, cv2.BORDER_CONSTANT,value=[255,255]) | |
| resizing = cv2.resize(border, None, fx=2, fy=2, interpolation=cv2.INTER_CUBIC) | |
| dilation = cv2.dilate(resizing, kernel,iterations=1) | |
| erosion = cv2.erode(dilation, kernel,iterations=2) | |
| out = pytesseract.image_to_string(erosion) | |
| if(len(out)==0): | |
| out = pytesseract.image_to_string(erosion, config='--psm 3') | |
| inner = inner +" "+ out | |
| outer.append(inner) | |
| #Creating a dataframe of the generated OCR list | |
| arr = np.array(outer) | |
| dataframe = pd.DataFrame(arr.reshape(len(row), countcol)) | |
| print(dataframe) | |
| data = dataframe.style.set_properties(align="left") | |
| #Converting it in a excel-file | |
| data.to_excel("/Users/marius/Desktop/output.xlsx") |
Hi
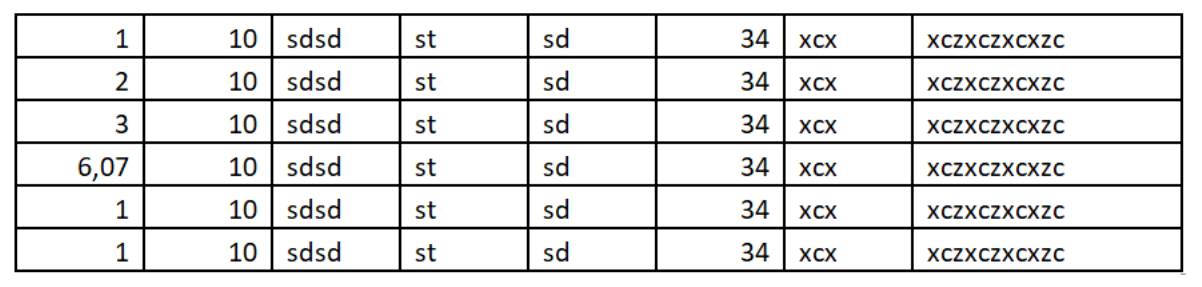
This code is not able to read the numbers in the first cell and also few from second cell in this attached .png file. As per my debugging the code is failing at the below step, while extracting the values.
Step written as comment: "#from every single image-based cell/box the strings are extracted via pytesseract and stored in a list"
Could you please help me decoding the issue. Attaching the file for your reference.
Kindly let me know if you need any further input.
Hi
Could you please help me with this issue. I am waiting for the same.
Dear sir, i need some helps. If the image is not screenshot picture, but a photo taken using cell phone, what should i do to extract the excel from the photo of tabular. Just as the following, thanks for your kind share.

Dear Marius,
congratulations for the great job!
I am trying to run your script on MacOS with no success.
Even with the test image on the website:
https://towardsdatascience.com/a-table-detection-cell-recognition-and-text-extraction-algorithm-to-convert-tables-to-excel-files-902edcf289ec
When I run
python cellrecognition.py
The images are plotted as expected, but in the end I get the following output:
[[1676, 552, 264, 40], [1407, 552, 265, 40], [1140, 552, 263, 40], [871, 552, 265, 40], [335, 552, 532, 40], [66, 552, 265, 40]]
[[[1676, 104, 264, 40], [1407, 104, 265, 40], [1140, 104, 263, 40], [871, 104, 265, 40], [602, 104, 265, 40], [335, 104, 263, 40], [66, 104, 265, 40]], [[1676, 148, 264, 38], [1407, 148, 265, 38], [1140, 148, 263, 38], [871, 148, 265, 38], [602, 148, 265, 38], [335, 148, 263, 38], [66, 148, 265, 38]], [[1676, 199, 264, 42], [1407, 199, 265, 42], [1140, 199, 263, 42], [871, 199, 265, 42], [335, 199, 532, 42], [66, 199, 265, 42]], [[1676, 245, 264, 40], [1407, 245, 265, 40], [1140, 245, 263, 40], [871, 245, 265, 40], [335, 245, 532, 40], [66, 245, 265, 40]], [[1676, 289, 264, 40], [1407, 289, 265, 40], [1140, 289, 264, 40], [871, 289, 265, 40], [335, 289, 532, 40], [66, 289, 265, 40]], [[1676, 333, 264, 38], [1407, 333, 265, 38], [1140, 333, 264, 38], [871, 333, 265, 38], [335, 333, 532, 38], [66, 333, 265, 38]], [[1676, 375, 264, 40], [1407, 375, 265, 40], [1140, 375, 264, 40], [871, 375, 265, 40], [335, 375, 532, 40], [66, 375, 265, 40]], [[1676, 419, 264, 42], [1407, 419, 265, 42], [1140, 419, 264, 42], [871, 419, 265, 42], [335, 419, 532, 42], [66, 419, 265, 42]], [[1676, 464, 264, 40], [1407, 464, 265, 40], [1140, 464, 263, 40], [871, 464, 265, 40], [335, 464, 532, 40], [66, 464, 265, 40]], [[1676, 508, 264, 40], [1407, 508, 265, 40], [1140, 508, 263, 40], [871, 508, 265, 40], [335, 508, 532, 40], [66, 508, 265, 40]], [[1676, 552, 264, 40], [1407, 552, 265, 40], [1140, 552, 263, 40], [871, 552, 265, 40], [335, 552, 532, 40], [66, 552, 265, 40]]]
[ 198  601 1003 1271 1539 1808]

                                         0                              1          2           3                 4               5
0    Consultant:\n
                     Project:\n
                                Kaliro Siduco\n
                                                   XGTR\n

                                                                          Customer:\n
                                                                                        Tech Alive\n

1          Date:\n
                          Team:\n
                                  21 May 2020\n


                                                                       Customer-ID:\n
                                                                                         443228-XY\n

2       Position\n
                                       Service\n

                                                             Factor\n
                                                                              Amount\n
                                                                                               Unit\n

3
                               Backend Support\n


                                                                                  10\n
                                                                                              hours\n

4
                                 Team Meetings\n


                                                                                              hours\n

5
                        Milestone Presentation\n


                                                                                              hours\n

6
                              Code Refactoring\n


                                                                                              hours\n

7
                                     Migration\n


                                                                                              hours\n

8
                                    Next Steps\n


                                                                                              hours\n

9


10

                                                   Total\n

                                                                                  30\n
                                                                                              hours\n

Traceback (most recent call last):
  File "cellrecognition.py", line 194, in <module>
    data.to_excel("/Users/nunzio/tmp/output.xlsx")
  File "/opt/miniconda3/lib/python3.7/site-packages/pandas/io/formats/style.py", line 235, in to_excel
    engine=engine,
  File "/opt/miniconda3/lib/python3.7/site-packages/pandas/io/formats/excel.py", line 739, in write
    freeze_panes=freeze_panes,
  File "/opt/miniconda3/lib/python3.7/site-packages/pandas/io/excel/_openpyxl.py", line 425, in write_cells
    xcell.value, fmt = self._value_with_fmt(cell.val)
  File "/opt/miniconda3/lib/python3.7/site-packages/openpyxl/cell/cell.py", line 216, in value
    self._bind_value(value)
  File "/opt/miniconda3/lib/python3.7/site-packages/openpyxl/cell/cell.py", line 192, in _bind_value
    value = self.check_string(value)
  File "/opt/miniconda3/lib/python3.7/site-packages/openpyxl/cell/cell.py", line 159, in check_string
    raise IllegalCharacterError
openpyxl.utils.exceptions.IllegalCharacterError
Do you have any suggestions for trying and solve this issue?
Best,
N
Its successful. You sent me the fully printed table. The error occurs in turning the result into an excel table. Your conda installation causes this error. Update Anaconda or try to find the solution by using the error message in google best, marius Von meinem iPhone gesendet
…
Yep, you're right. I had to specify the data.to_excel engine after installing the proper module. Also needed to specify numbers to be exported as numbers instead of strings:
writer = pd.ExcelWriter('/Users/nunzio/tmp/ciao.xlsx',
                        engine='xlsxwriter',
                        options={'strings_to_numbers': True})
data.to_excel(writer)

writer.save()
Now my problem is with tesseract correctly recognising the table fields. The table originally comes from a scanned pdf file, I have found that reducing the resolution in the converted PNG gives more reasonable results. I also noted that a certain number of newlines (and maybe carriage returns) are added at the end of each field. For some tables it works with:
out = pytesseract.image_to_string(erosion)[:-2]
and then:
                out = out.replace('\n','')
                out = out.replace('\r','')
                out = out.replace('\t','')
                out = out.replace(' ','')
Just to make sure.
Please find attached a sample table if you have time to have a look.
Thanks again,
N

@huks0: The variable i is a little ambiguous at line 145. It is causing an error.

I ran it on your medium blog image it shows errors.
check here
Amount values are missing. Also, it read the text outside the table.

How can we get the co-ordinates of the cells
Hi,
In 175 lines you have not declared the bitnot because when I run this code it give me an error Undefined bitnot . How solve it or which bitnot images .please tell me.
On line 182 and 184, wouldn't it be better to only OCR just once (just on line 182), by specifying a general configuration, like
pytesseract.image_to_string(erosion, config='-l eng --psm 3')
Then check if the length of the text equals zero and decide whether to append it into the existing variable string?
Cause the already existing solution you've created, perform OCR twice which increases the run time.
Not recognized correctly. cannot extract it 
Hi your code worked perfectly thanks. just added a loop to to run through an image folder and append tables to excel file.

its not detecting properl
Will it work if my table doesn't have vertical and horizontal lines?