Last active
August 13, 2022 08:04
-
-
Save hxhc/5467e5fe78141bb779c2117e0217387b to your computer and use it in GitHub Desktop.
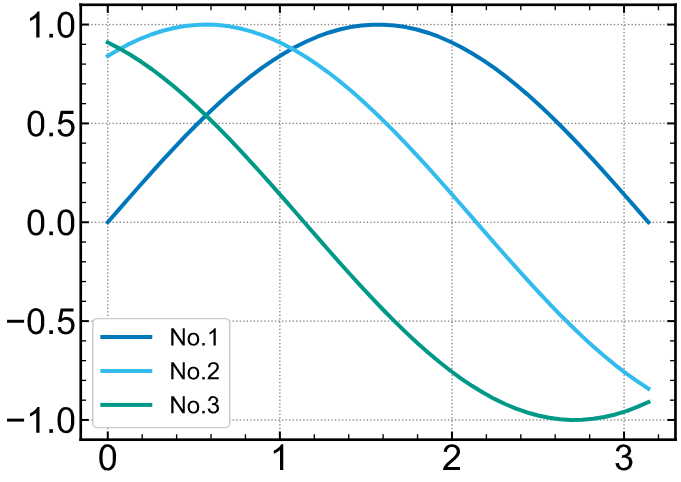
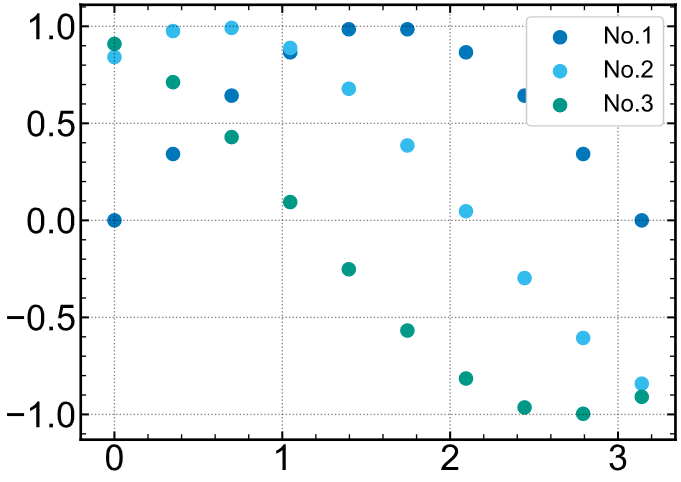
The customized matplotlib style for scientific plot with large font size, linewidth and scatter size
This file contains bidirectional Unicode text that may be interpreted or compiled differently than what appears below. To review, open the file in an editor that reveals hidden Unicode characters.
Learn more about bidirectional Unicode characters
| # It is a modified version of garrettj403/SciencePlots/science.mplstyle | |
| # (https://github.com/garrettj403/SciencePlots/blob/master/styles/science.mplstyle) | |
| # Set color cycle: using vibrant palette | |
| axes.prop_cycle : cycler('color', ['EE7733', '0077BB', '009988', 'CC3311', '33BBEE', 'EE3377', 'BBBBBB']) | |
| # Set default figure size | |
| figure.figsize : 8, 6 | |
| # Set font size | |
| legend.fontsize: 24 | |
| axes.labelsize: 28 | |
| axes.titlesize: 28 | |
| xtick.labelsize: 28 | |
| ytick.labelsize: 28 | |
| axes.titlepad: 10 | |
| # Set x axis | |
| xtick.direction : in | |
| xtick.major.size : 6 | |
| xtick.major.width : 1.5 | |
| xtick.minor.size : 4 | |
| xtick.minor.width : 1 | |
| xtick.minor.visible : True | |
| xtick.top : True | |
| # Set y axis | |
| ytick.direction : in | |
| ytick.major.size : 6 | |
| ytick.major.width : 1.5 | |
| ytick.minor.size : 4 | |
| ytick.minor.width : 1 | |
| ytick.minor.visible : True | |
| ytick.right : True | |
| # Set line widths | |
| axes.linewidth : 2 | |
| grid.linewidth : 1 | |
| lines.linewidth : 3 | |
| lines.markersize : 10 | |
| axes.grid : False | |
| # Remove legend frame | |
| legend.frameon : False | |
| # Always save as 'tight' | |
| savefig.bbox : tight | |
| savefig.pad_inches : 0.05 | |
| # Use sans-serif fonts | |
| font.sans-serif : Arial | |
| font.family : sans-serif | |
| mathtext.fontset : dejavuserif |
This file contains bidirectional Unicode text that may be interpreted or compiled differently than what appears below. To review, open the file in an editor that reveals hidden Unicode characters.
Learn more about bidirectional Unicode characters
| # To use vibrant, grid styles, first install SciencePlots. Note that vibrant is color-blind safe | |
| # pip install SciencePlots | |
| size = 36 # font size should be larger than 24, and I use 36 to control different sizes | |
| plt.style.use(["vibrant", "grid"]) | |
| params = { | |
| "legend.fontsize": size * 0.5, | |
| "axes.labelsize": size * 0.75, | |
| "axes.titlesize": size * 0.75, | |
| "xtick.labelsize": size * 0.75, | |
| "ytick.labelsize": size * 0.75, | |
| "axes.titlepad": 20, | |
| "xtick.direction": "in", | |
| # xtick | |
| "xtick.major.size": 6, | |
| "xtick.major.width": 1.5, | |
| "xtick.minor.size": 4, | |
| "xtick.minor.width": 1, | |
| # ytick | |
| "ytick.major.size": 6, | |
| "ytick.major.width": 1.5, | |
| "ytick.minor.size": 4, | |
| "ytick.minor.width": 1, | |
| # linewidth | |
| "axes.linewidth": 2, | |
| "grid.linewidth": 1, | |
| "lines.linewidth": 3, | |
| "lines.markersize": 10, | |
| "axes.grid": False, # delete this line before using grid style | |
| # font-family | |
| "font.sans-serif": ["Arial"], | |
| "font.family": "sans-serif", | |
| "mathtext.fontset": "dejavuserif", | |
| # Remove legend frame | |
| "legend.frameon": False, # delete this line before use grid style | |
| # Always save as 'tight' | |
| "savefig.bbox": "tight", | |
| "savefig.pad_inches": 0.05 | |
| } | |
| plt.rcParams.update(params) | |
| fig = plt.figure(figsize=(16, 6)) # default size for a single axe is (8, 6) | |
| fig.subplots_adjust(hspace=0.3, wspace=0.2) | |
| ax1 = fig.add_subplot(1, 2, 1) | |
| ax2 = fig.add_subplot(1, 2, 2) |
Sign up for free
to join this conversation on GitHub.
Already have an account?
Sign in to comment
And here are demos with grid style on.