This is entry-level article about the right JMS benchmarking at the JVM languages (java, kotlin, scala, etc.). It is useful for cases when you'd like to demonstrate function performance difference because of implementation change.
All examples are based on Kotlin language and for Gradle build system. Source code is available on github.
First of all let's understand how to use JMH. Java Microbenchmark Harness - library set for the small function performance measurement ("small function" means that GC pause has major affect of the target function execution time).
JMH recompiles your code before test start:
- To mitigate fluctuations and decrease mistake it is better to execute function N times. Next you can calculate total time and divide it to N.
- To do item above you can wrap function calls into the loop. However
forcan affect target function performance, because your will also see time spent to the loop support and to virtual call overhead. Therefore you have to just repeat target bytecode N times (of course without reflection and any additional operations in the middle).
After bytecode reassembling you can just start benchmark gathering by calling java -jar benchmarks.jar, because all components are already packed into the solid jar file.
As you can see above you are not able just to add a lot of libraries into the classpath and start test execution in JUnit style. Therefore we have to use maven/gradle plugin for the such repackaging. Gradle is more popular for the new projects therefore let's choose it.
There is semi-official gradle plugin for JMH operations - jmh-gradle-plugin. So let's add it into the project:
buildscript {
    repositories {
        mavenCentral()

        maven {
            url "https://plugins.gradle.org/m2/"
        }
    }
    dependencies {
        classpath "me.champeau.gradle:jmh-gradle-plugin:$jmh_gradle_plugin_version"
    }
}

apply plugin: "me.champeau.gradle.jmh"
Plugin creates new source set automatically (source set is "set of files and resources which should be compiled and run together"), details are in official gradle documentation). jmh source set inheritcs main, so we have the following sequence:
- Our ordinal code we will place at the main source set. There are not any benchmark-related code there.
- Benchmark wrappers are placed at the jmh source set. JMH classpath is available here, however this source set will be re-assembled by tool. So it is better to keep the smallest portion of code here.
So we get the following folders hierarchy:
- src
- jmh / kotlin/ [java package name] / [benchmark-related code]
- main / kotlin / [java package name] / [code for measurement]
And IntelliJ Idea will display project like this:
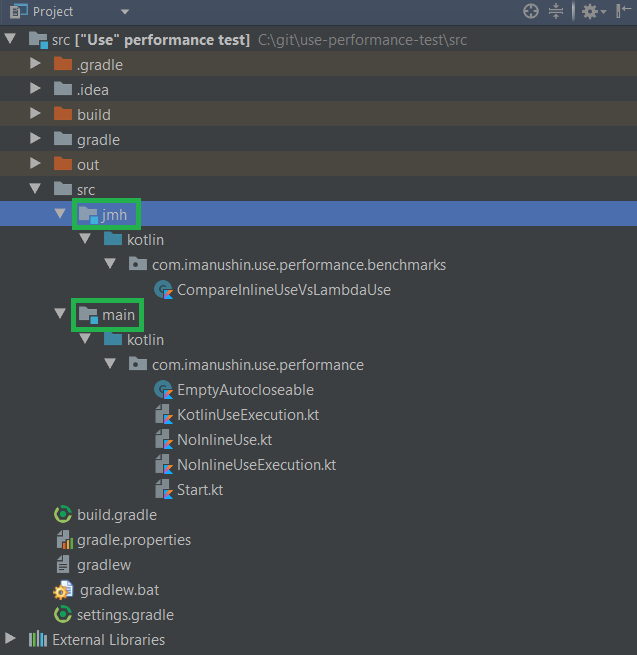
Finally we are able to start tests by executing .\gradlew.bat jmh (or .\gradlew jmh for Linux, Mac, BSD)
This plugin has couple of interesting Windows-related traits:
- JMH sometimes forks the java process. You could not do this on Windows without difficulties, therefore JMH just starts another process with the same classpath. So all jar files are added into the command line, which has limited side. If your
GRADLE_USER_HOME(this is folder with Gradle dependency cache) has long path, you will receive too huge command line (with repeated statements likec:\users\someUser\.gradle\caches). Of course Windows diallow you to start process with such monstrous parameter list. Therefore if JMH is not able to do fork - just use caches folder with shorter path. In the other words: just create folderc:\g, copy all files from gradle cache to there and define environment variable GRADLE_USER_HOME asc:\g. - Sometimes previous benchmarking process does file lock (as I understand, this is bug of byte code rewrite tool). Then your next compilation will fail, because file is opened in write mode. To fix this - just execute
.\gradlew.bat --stop. This command asks Gradle to stop daemon processes (they are not stop automatically yo speedup next compilation speed). - JMH tool rewrites your jar files, therefore (to avoid strange issues) it is better to avoid any incremental compilation. So execute
.\gradlew.bat cleanbefore any next benchmarking attempt.
As an example I will use question (previously highlighted at kotlin discussions), which is interesting for me: why Kotlin function "use" is defined with inline compilation option?
Java has pattern - try with resources, which allows calling method close automatically after try block leaving. Moreover it has exception handling to avoid exception information loosing during the "exception inside catch block" behavior. .Net world analogue - using keyword for IDisposable interfaces.
Java code example:
try (BufferedReader reader = Files.newBufferedReader(file, charset)) { //this try is our statement
    /*read something from file*/
}
Kotlin language has exact the same method, which has a bit different syntax:
Files.newBufferedReader(file, charset)).use { reader ->
	/*read something from file*/
}
As you can see:
useis just extension method. It is not language keywordtryin Java andusingin C#.useis inline method, e.g. absolutely the same constructions are injected into the each method. This one increases bytecode size, therefore (just theory) it is more complex for JIT to optimize such functions. And this theory we check.
So we should create two methods:
- First one does operations with
usefrom kotlin library. - Second one does use exact the same actions, however without inline optimizations. So each call created new object in the heap (with labmda and all necessary arguments).
And code with JMH attributes will execute different functions:
@BenchmarkMode(Mode.All) // test in all available modes
@Warmup(iterations = 10) // number of iterations to warmup Java Virtual Machine
@Measurement(iterations = 100, batchSize = 10) // number of measurement operations, each one have 10 our test method calls
open class CompareInlineUseVsLambdaUse {

    @Benchmark
    fun inlineUse(blackhole: Blackhole) {
        NoopAutoCloseable(blackhole).use {
            blackhole.consume(1)
        }
    }

    @Benchmark
    fun lambdaUse(blackhole: Blackhole) {
        NoopAutoCloseable(blackhole).useNoInline {
            blackhole.consume(1)
        }
    }
}Java Compiler & JIT are really smart. They have a lot of in compile-time and in runtime optimizations. Method below can be collapsed into one line:
fun sum() : Unit {
    val a = 1
    val b = 2

    a + b;
}
And then we will test something like this:
fun sum() : Unit {
    3;
}
However method result is unused, therefore compilers (byte code + JIT) may just remove whole method, because it do nothing.
To avoid the last one you can use Blackhole class from JMH framework. It has a lot of methods which does nothing (from the our side), however compilers think that our result is needed for someone.
To avoid javac optimizations of the beginning (when it tries to sum a and b in the compile time) we can define state for our variables. So real test uses prepared object. Therefore we don't spend time of the object constructions. However JIT thinks that input variables are completely undefined.
So for proper performance measurement we may write the following:
fun sum(blackhole: Blackhole) : Unit {
    val a = state.a // compiler does not know value of a
    val b = state.b

    val result = a + b;

    blackhole.consume(result) // JIT could not exclude result computation, because looks like it is needed for someone
}
Here we get a and b from a state, which prevents equation computation by javac. And next we sends result to the black hole, which prevents JIT to drop the last function part.
Let's return to out testing function:
- Object to call
closemethod I create inside the test. It is correct because in the most cases we create object for the close method call (e.g. in the most scenarios count of theclosemethods calls is equal or less with count of class instances creation, which hasclosemethod). - And we call blackhole method inside out block to avoid inlining by JIT (and prevent for JIT dropping unnecessary code).
Call ./gradle jmh and wait for about two hours. Finally you get the following results (I did all tests in the my mac mini 2015):
# Run complete. Total time: 01:51:54

Benchmark                                                  Mode       Cnt         Score       Error  Units
CompareInlineUseVsLambdaUse.inlineUse                     thrpt      1000  11689940,039 ± 21367,847  ops/s
CompareInlineUseVsLambdaUse.lambdaUse                     thrpt      1000  11561748,220 ± 44580,699  ops/s
CompareInlineUseVsLambdaUse.inlineUse                      avgt      1000        ≈ 10⁻⁷               s/op
CompareInlineUseVsLambdaUse.lambdaUse                      avgt      1000        ≈ 10⁻⁷               s/op
CompareInlineUseVsLambdaUse.inlineUse                    sample  21976631        ≈ 10⁻⁷               s/op
CompareInlineUseVsLambdaUse.inlineUse:inlineUse·p0.00    sample                  ≈ 10⁻⁷               s/op
CompareInlineUseVsLambdaUse.inlineUse:inlineUse·p0.50    sample                  ≈ 10⁻⁷               s/op
CompareInlineUseVsLambdaUse.inlineUse:inlineUse·p0.90    sample                  ≈ 10⁻⁷               s/op
CompareInlineUseVsLambdaUse.inlineUse:inlineUse·p0.95    sample                  ≈ 10⁻⁷               s/op
CompareInlineUseVsLambdaUse.inlineUse:inlineUse·p0.99    sample                  ≈ 10⁻⁷               s/op
CompareInlineUseVsLambdaUse.inlineUse:inlineUse·p0.999   sample                  ≈ 10⁻⁵               s/op
CompareInlineUseVsLambdaUse.inlineUse:inlineUse·p0.9999  sample                  ≈ 10⁻⁵               s/op
CompareInlineUseVsLambdaUse.inlineUse:inlineUse·p1.00    sample                   0,005               s/op
CompareInlineUseVsLambdaUse.lambdaUse                    sample  21772966        ≈ 10⁻⁷               s/op
CompareInlineUseVsLambdaUse.lambdaUse:lambdaUse·p0.00    sample                  ≈ 10⁻⁸               s/op
CompareInlineUseVsLambdaUse.lambdaUse:lambdaUse·p0.50    sample                  ≈ 10⁻⁷               s/op
CompareInlineUseVsLambdaUse.lambdaUse:lambdaUse·p0.90    sample                  ≈ 10⁻⁷               s/op
CompareInlineUseVsLambdaUse.lambdaUse:lambdaUse·p0.95    sample                  ≈ 10⁻⁷               s/op
CompareInlineUseVsLambdaUse.lambdaUse:lambdaUse·p0.99    sample                  ≈ 10⁻⁷               s/op
CompareInlineUseVsLambdaUse.lambdaUse:lambdaUse·p0.999   sample                  ≈ 10⁻⁵               s/op
CompareInlineUseVsLambdaUse.lambdaUse:lambdaUse·p0.9999  sample                  ≈ 10⁻⁵               s/op
CompareInlineUseVsLambdaUse.lambdaUse:lambdaUse·p1.00    sample                   0,010               s/op
CompareInlineUseVsLambdaUse.inlineUse                        ss      1000        ≈ 10⁻⁵               s/op
CompareInlineUseVsLambdaUse.lambdaUse                        ss      1000        ≈ 10⁻⁵               s/op

Benchmark result is saved to /Users/imanushin/git/use-performance-test/src/build/reports/jmh/results.txt
And let's short the table:
Benchmark  Mode        Cnt         Score       Error  Units
inlineUse   thrpt      1000  11689940,039 ± 21367,847  ops/s
lambdaUse   thrpt      1000  11561748,220 ± 44580,699  ops/s
inlineUse    avgt      1000        ≈ 10⁻⁷               s/op
lambdaUse    avgt      1000        ≈ 10⁻⁷               s/op
inlineUse  sample  21976631        ≈ 10⁻⁷               s/op
lambdaUse  sample  21772966        ≈ 10⁻⁷               s/op
inlineUse      ss      1000        ≈ 10⁻⁵               s/op
lambdaUse      ss      1000        ≈ 10⁻⁵               s/op
There are the following important metrics in the results:
- Inline method has speed
11,6 * 10^6 ± 0,02 * 10^6operations per seconds. - Lambda-based method has speed
11,5 * 10^6 ± 0,04 * 10^6operations per second. - Inline method works faster and with less time variance. Probably
lambdaUsehigher speed mistake is cause of more memory opertions. - And finally I war wront the forum - for performance reasons it is better to keep current method implementation in the kotlin standard library
By my opinion, there are two the most frequent scenarious of the performance comparison;
- Measure timing of the function, which will call the target method N times
- Philosophy talks like "I as certified IT developer absolute sure, that variable shifting works faster than multiplication by 2"
However each scilled engineer knows, that both ways lead to the mistaken opinions, application slowness, etc. I hope that this article helps you to create perfect and fast applications.