Skip to content

Instantly share code, notes, and snippets.

@isaacarnault
Last active February 17, 2024 18:42
Show Gist options
  • Star 9 You must be signed in to star a gist
  • Fork 11 You must be signed in to fork a gist
  • Save isaacarnault/15873ff613af833f9693e1a595bdfcc6 to your computer and use it in GitHub Desktop.
Save isaacarnault/15873ff613af833f9693e1a595bdfcc6 to your computer and use it in GitHub Desktop.
Data collection using Python

Data collection and statistics using Python and R

Project Status: Concept – Minimal or no implementation has been done yet, or the repository is only intended to be a limited example, demo, or proof-of-concept.

Scripting in Python and R

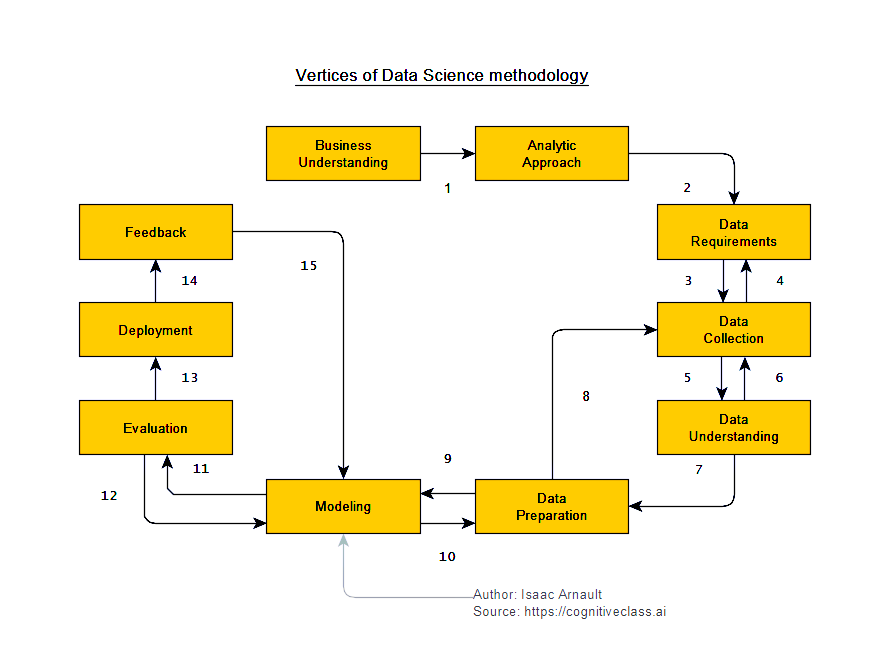
The following gist offers a focus on Data Collection, one of the stages* of the Data Science methodology. We will also perform basic math operations on a single dataframe to see how they render using Python or R.

Versioning

I used no versioning system for this gist. My gist gist's repos status is flagged as concept because it is intended to be a demo or POC (proof-of-concept).

Author

Licence

All public gists https://gist.github.com/isaacarnault
Copyright 2018, Isaac Arnault
MIT License, http://www.opensource.org/licenses/mit-license.php

Sources

Exercise

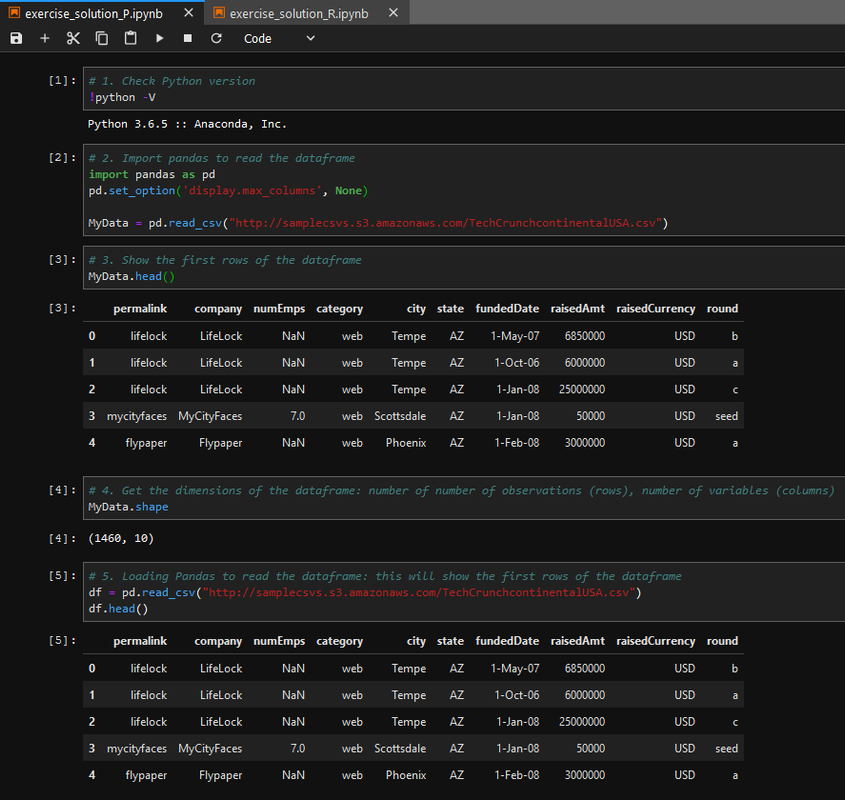
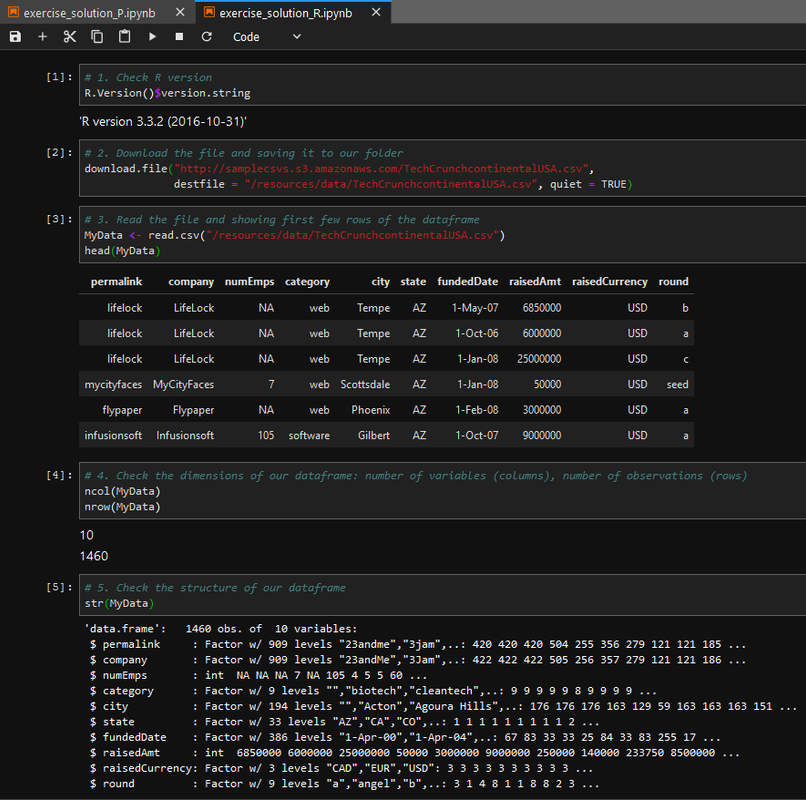
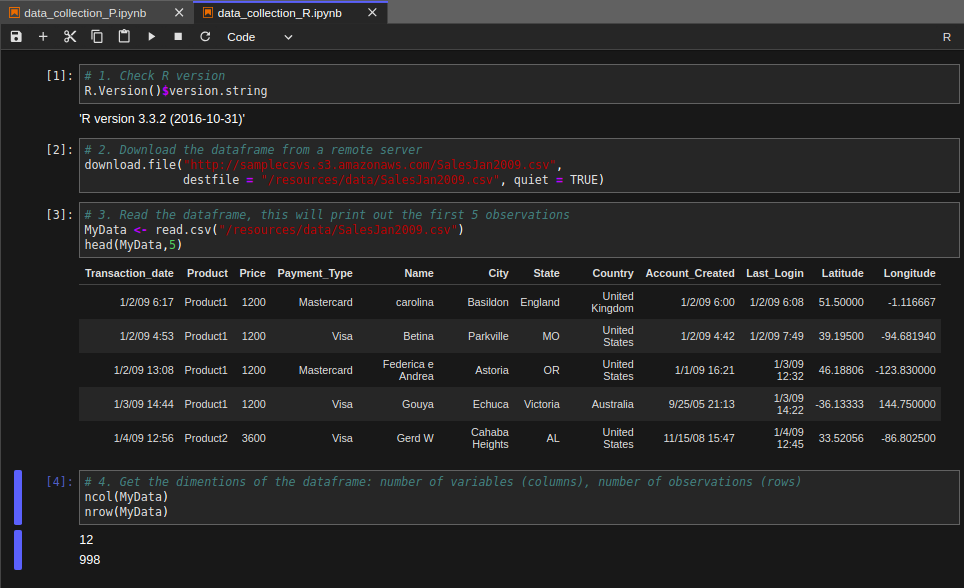
  • Perform a data collection in Python and R using Jupyter.
    ⇢ Use the following dataframe from Spatialkey.com.
  • How many observations and variables does the dataframe contain? Base your assessment on your scripting outputs.
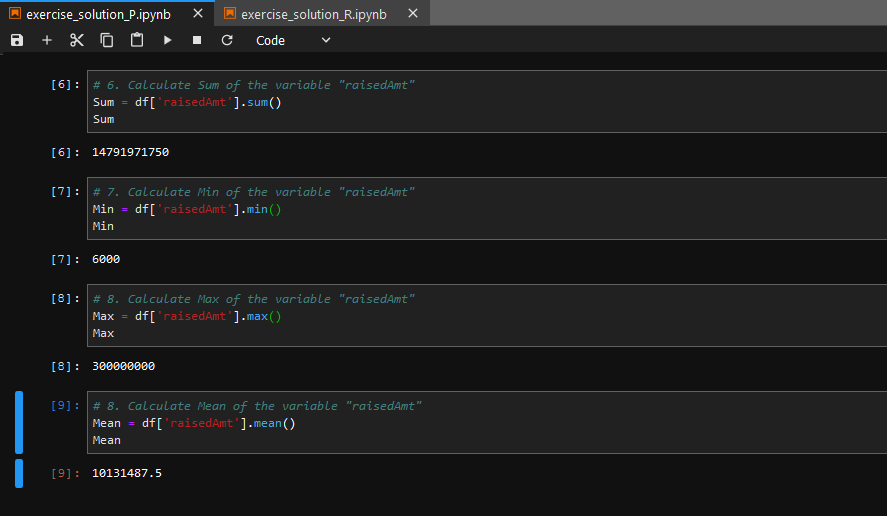
  • Calculate Sum, Min, Max and Mean of variable "raisedAmt" using Python (and Pandas) and using R.
    — (*) Ten stages are crucial regarding Data Science methodology, among which Data collection. See architecture.md.
Vertices of Data Science methodology

isaac-arnault-data-science-methodology.png

Question answer

There are 10 variables and 1461 observations in the dataframe.

Calculations using Python and R

Sum = 14791971750
Min = 6000
Max = 300000000
Mean = 10131487.5 # Using R in Jupyter, otherwise Mean = 10131488 in RStudio

Complete solution using Python and Pandas

isaac-arnault-using-pandas-P.png

isaac-arnault-using-pandas-P-2.png

Complete solution using R

isaac-arnault-using-pandas-R.png

isaac-arnault-using-pandas-R2.png

Data collection using Python

See output

isaac-arnault-data-collection-P.png

Data collection using R

See output

isaac-arnault-data-collection-using-R.png

#1 Checking Python version
!python -V
#2 Import pandas to read the dataframe
import pandas as pd
pd.set_option('display.max_columns', None)
MyData = pd.read_csv("http://samplecsvs.s3.amazonaws.com/SalesJan2009.csv")
#3 Show the first rows of the dataframe
MyData.head()
#4 Get the dimensions of the dataframe
MyData.shape
# Full code
!python -V
import pandas as pd
pd.set_option('display.max_columns', None)
MyData = pd.read_csv("http://samplecsvs.s3.amazonaws.com/SalesJan2009.csv")
#3 Show the first rows of the dataframe
MyData.head()
MyData.shape
#1 Checking R version
R.Version()$version.string
#2 Download the dataframe from a remote server
download.file("http://samplecsvs.s3.amazonaws.com/SalesJan2009.csv",
destfile="/resources/data/SalesJan2009.csv", quiet = TRUE)
#3 Read the dataframe, this will print out the first 5 observations
MyData <- read.csv("/resources/data/SalesJan2009.csv")
head(MyData, 5)
#4 Get the dimensions of the dataframe: number of variables (columns), number of observations (rows)
ncol(MyData)
nrow(MyData)
# Full code
R.Version()$version.string
download.file("http://samplecsvs.s3.amazonaws.com/SalesJan2009.csv",
destfile="/resources/data/SalesJan2009.csv", quiet = TRUE)
MyData <- read.csv("/resources/data/SalesJan2009.csv")
head(MyData, 5)
ncol(MyData)
nrow(MyData)
Sign up for free to join this conversation on GitHub. Already have an account? Sign in to comment