Last active
July 5, 2019 04:29
-
-
Save isnowfy/5509275 to your computer and use it in GitHub Desktop.
dft
This file contains bidirectional Unicode text that may be interpreted or compiled differently than what appears below. To review, open the file in an editor that reveals hidden Unicode characters.
Learn more about bidirectional Unicode characters
| # Example usage | |
| # $ python dft.py | gnuplot | |
| # 9 | |
| # 0 0 | |
| # 1 1 | |
| # 2 2 | |
| # 0 2 | |
| # 1 1 | |
| # -1 1 | |
| # 0 2 | |
| # -2 2 | |
| # -1 1 | |
| import math | |
| N = int(raw_input()) | |
| f = [] | |
| for i in range(N): | |
| (x, y) = map(float, raw_input().split()) | |
| f.append(complex(x, y)) | |
| F = [] | |
| for i in range(N): | |
| ang = -2 * 1j * math.pi * i / N | |
| r = 0 | |
| for j in range(N): | |
| r += (math.e ** (ang * j)) * f[j] | |
| F.append(r) | |
| print "set parametric" | |
| print "set samples", N + 1 | |
| print "x(t)=", | |
| for i in range(N): | |
| ang = 2 * math.pi * i / N | |
| if i > 0: | |
| print "+", | |
| print F[i].real / N, "*cos(", ang, "*t)-", | |
| print F[i].imag / N, "*sin(", ang, "*t)", | |
| print "y(t)=", | |
| for i in range(N): | |
| ang = 2 * math.pi * i / N | |
| if i > 0: | |
| print "+", | |
| print F[i].imag / N, "*cos(", ang, "*t)+", | |
| print F[i].real / N, "*sin(", ang, "*t)", | |
| print "plot [t=0:", N, "] x(t), y(t)" | |
| print "pause 60" |
Sign up for free
to join this conversation on GitHub.
Already have an account?
Sign in to comment
I try to plot the graph in Desmos, but it gives out a lot of circles...
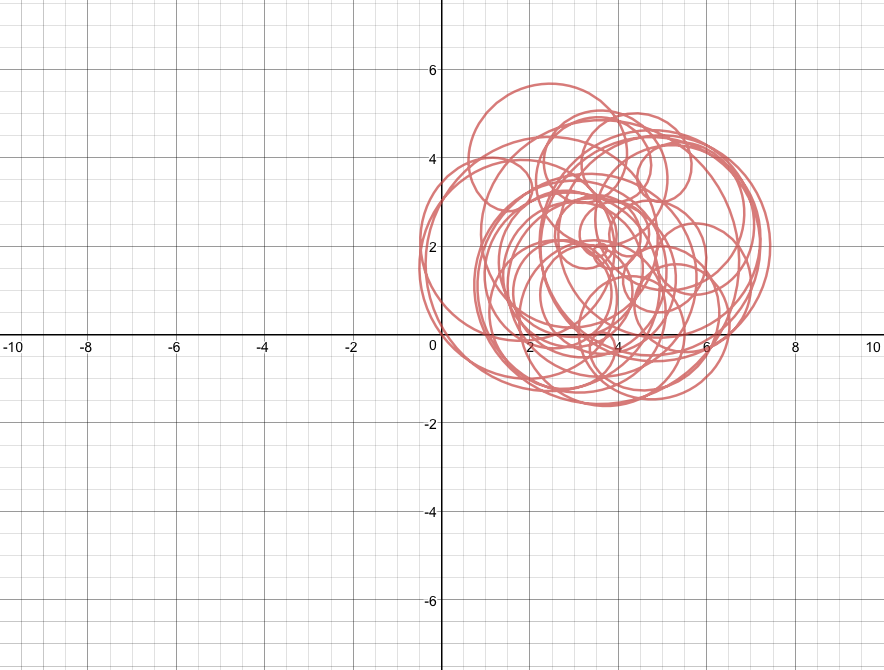
The equation is the one on your blog.
Seems if samples are too high, the graph will be in chaos, like the projection of the curve in the complex space to the plane.